I have seen power law, the rainbow chart, and stock to flow.
For me, none of these are really elegant models, nor are they likely.
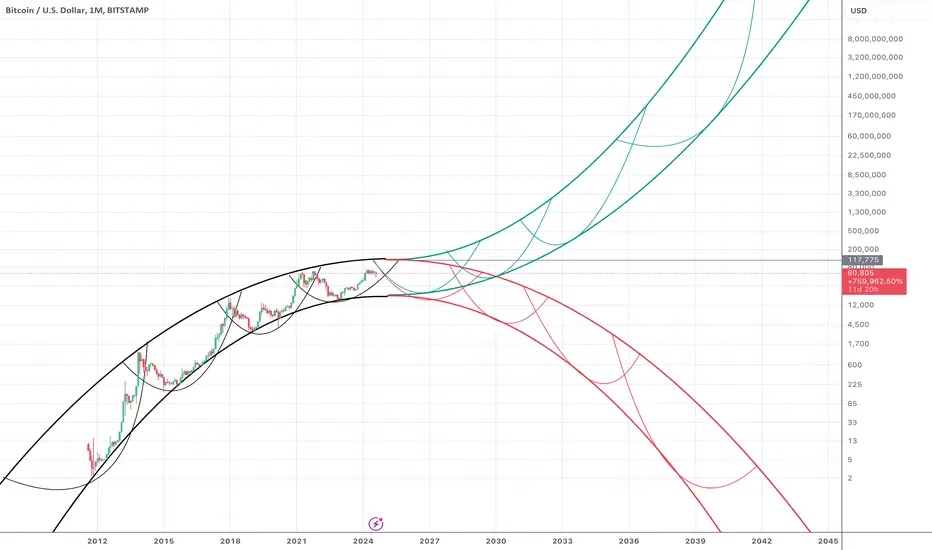
I believe Bitcoin's price will follow one of two paths over the next 15 years: Either become the global digital money replacing all fiat and go to infinity relative to any fiat, or go to zero. These parallel futures are easily charted using simple arcs. In fact, Bitcoin's past highs and lows fit perfectly into two pure mathematical arcs I've charted here. It's almost uncanny how perfect it is.
On this chart, the black arcs frame the past.
The green arcs frame the future path of accelerating use as global money.
The red arcs frame the future path of failure and eventual worthlessness.
Now, we are almost at the deciding point. These arcs give us a cycle top of around $117,000, depending on when the top is - we can know with confidence we're not there yet, and it will be more than $100,000.
More importantly, the next cycle low will give us a big clue about which path humanity has chosen for Bitcoin. Will the bottom be supported by the green arc, or will it fall to the red arc support? Let's see.
Good luck and enjoy.
For me, none of these are really elegant models, nor are they likely.
I believe Bitcoin's price will follow one of two paths over the next 15 years: Either become the global digital money replacing all fiat and go to infinity relative to any fiat, or go to zero. These parallel futures are easily charted using simple arcs. In fact, Bitcoin's past highs and lows fit perfectly into two pure mathematical arcs I've charted here. It's almost uncanny how perfect it is.
On this chart, the black arcs frame the past.
The green arcs frame the future path of accelerating use as global money.
The red arcs frame the future path of failure and eventual worthlessness.
Now, we are almost at the deciding point. These arcs give us a cycle top of around $117,000, depending on when the top is - we can know with confidence we're not there yet, and it will be more than $100,000.
More importantly, the next cycle low will give us a big clue about which path humanity has chosen for Bitcoin. Will the bottom be supported by the green arc, or will it fall to the red arc support? Let's see.
Good luck and enjoy.
Disclaimer
The information and publications are not meant to be, and do not constitute, financial, investment, trading, or other types of advice or recommendations supplied or endorsed by TradingView. Read more in the Terms of Use.
Disclaimer
The information and publications are not meant to be, and do not constitute, financial, investment, trading, or other types of advice or recommendations supplied or endorsed by TradingView. Read more in the Terms of Use.