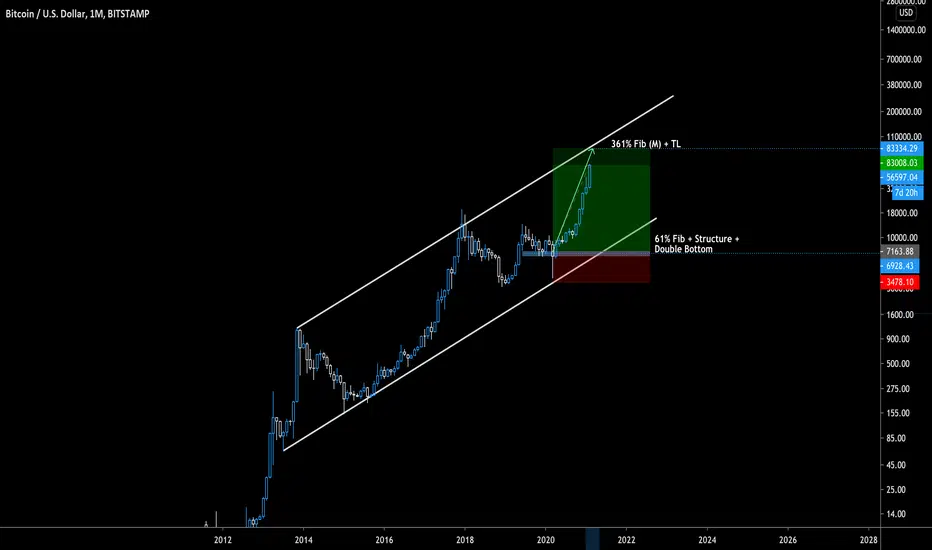
With the continued bullish momentum we could see a 100k touch sooner than expected. However, the 100k mark also coincides with a long-term trendline and the 361% fib of the monthly leg. Historically, when the chart touched this trendline we see a long-term "bear" corrective season transition.
Based on the charts momentum we could see the target reached in 3-5 bars (each bar equals ~1 month).
However, the smaller timeframes (weekly) touched the 161% target will a doji formed on top of a crescendoing wedge (reversal pattern). However, the weekly candle confirming a potential reversal will be closing shortly to reveal the probabilistic outcome of bitcoin in the near future.
Do you think we will see a weekly retracement? Will you HODL till 100k? Will you sell at 100k?
Disclaimer
The information and publications are not meant to be, and do not constitute, financial, investment, trading, or other types of advice or recommendations supplied or endorsed by TradingView. Read more in the Terms of Use.
Disclaimer
The information and publications are not meant to be, and do not constitute, financial, investment, trading, or other types of advice or recommendations supplied or endorsed by TradingView. Read more in the Terms of Use.