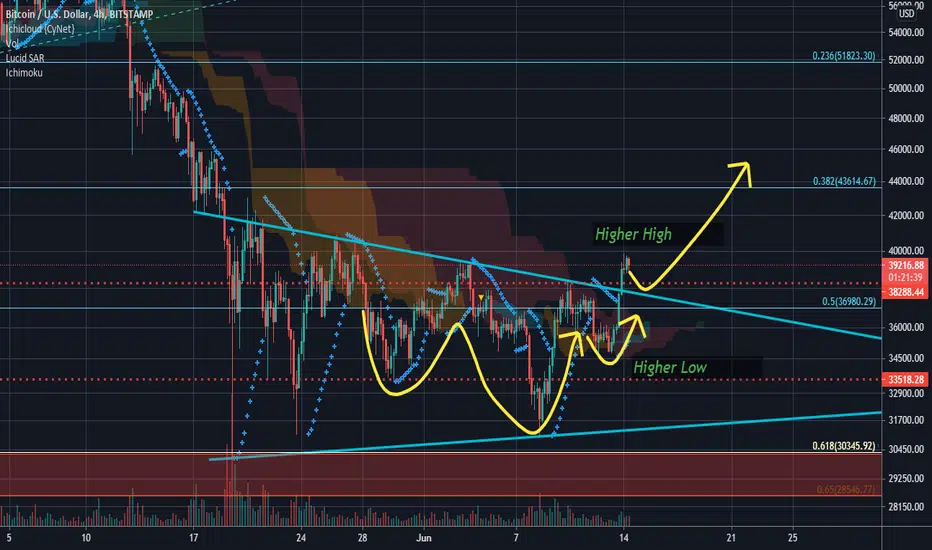
Higher low and higher high set on the 4 hrly.
Wait for retest of the top of the triangle as support for confirmation.
BTC had already retested the 61.8% Fib retracement level at ~30k USD.
Next level to look out for is the 38.2% Fib retracement level (@ ~43.6k USD), followed by the 23.6% Fib retracement level (@ ~51.8k USD).
Continued analysis from:

RSI and Stoch(RSI) regular bullish divergence on the daily.

MACD indicators bullish on the daily.

MA lines legend:
Red = 21 EMA
Green = 50 SMA
Thick Orange = 200 SMA
Thin Orange = 200 VWMA
Wait for retest of the top of the triangle as support for confirmation.
BTC had already retested the 61.8% Fib retracement level at ~30k USD.
Next level to look out for is the 38.2% Fib retracement level (@ ~43.6k USD), followed by the 23.6% Fib retracement level (@ ~51.8k USD).
Continued analysis from:
RSI and Stoch(RSI) regular bullish divergence on the daily.
MACD indicators bullish on the daily.
MA lines legend:
Red = 21 EMA
Green = 50 SMA
Thick Orange = 200 SMA
Thin Orange = 200 VWMA
Note
Daily-close confirmation. No volume confirmation yet.However the consolidation exhibited dominant accumulation-like characteristic/patterns on the lower time frames.
Note
6hrly Chart:Note
Caution Death cross on the daily looming:MA crosses are lagging indicators, however it being imminent will provide some downward pressure. However the impending death cross may also catalyze a short-squeeze bounce, as excessive shorts builds up in anticipation of the event..
Note
Note
Bouncing off support:Note
Disclaimer
The information and publications are not meant to be, and do not constitute, financial, investment, trading, or other types of advice or recommendations supplied or endorsed by TradingView. Read more in the Terms of Use.
Disclaimer
The information and publications are not meant to be, and do not constitute, financial, investment, trading, or other types of advice or recommendations supplied or endorsed by TradingView. Read more in the Terms of Use.