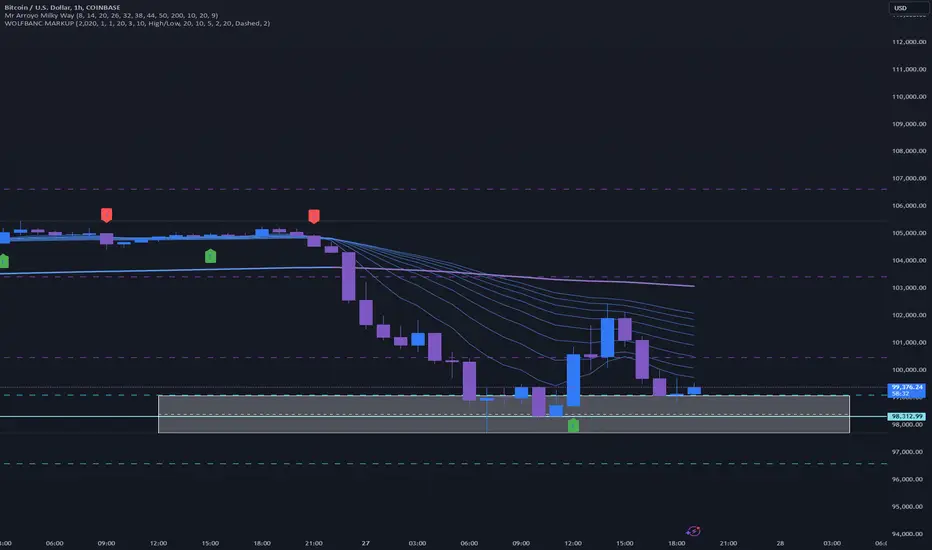
The recent market dump appears to be reaching a potential bottom, as evidenced by key technical signals and oversold conditions across multiple timeframes. Current price action suggests a strong possibility of a reversal, with $106,000 as a viable target in the coming weeks or months.
Key Points Supporting the Reversal:
Oversold Indicators: RSI and stochastic oscillators are showing extreme oversold levels, indicating exhaustion of the selling pressure.
Volume Analysis: A noticeable increase in buying volume at this level suggests smart money may be accumulating positions.
Fibonacci Retracement: The price has retraced to a key support level within the 61.8%-78.6% Fibonacci zone, historically a reversal area in bullish scenarios.
Trendline Support: The market is respecting a long-term ascending trendline, signaling a strong base for the next leg up.
Bullish Divergence: Momentum indicators like MACD are flashing bullish divergence, suggesting a potential shift in trend.
Trade Setup:
If this level holds, we could see a sharp bounce and eventual breakout toward $106,000. Watch for confirmation with a daily close above key resistance levels, and monitor macroeconomic factors for added confidence. Stop-loss placement below the recent low is recommended to manage risk effectively.
This setup requires patience and confirmation, but the risk-to-reward ratio appears highly favorable. Always trade with caution and ensure proper risk management.
Disclaimer
The information and publications are not meant to be, and do not constitute, financial, investment, trading, or other types of advice or recommendations supplied or endorsed by TradingView. Read more in the Terms of Use.
Disclaimer
The information and publications are not meant to be, and do not constitute, financial, investment, trading, or other types of advice or recommendations supplied or endorsed by TradingView. Read more in the Terms of Use.