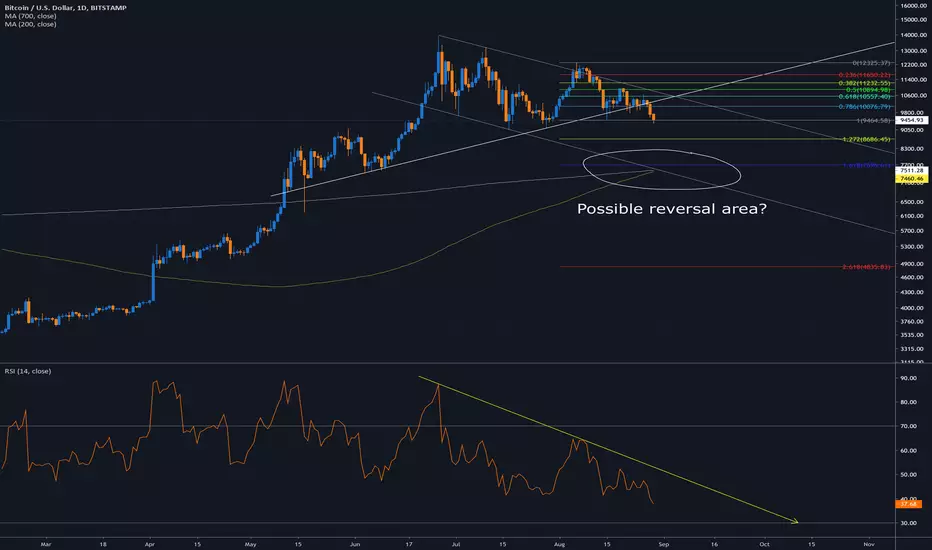
I zoomed in after my weekly analysis. I see a strong resistance zone at the 7400-7700 levels.
On the chart is the 200MA and the 700MA(=100MA from the weekly).
Also I have drawn a short-time Fibonacci retracement with the 1.618 at similar levels.
A strong reversal in this area would be a bullish sign, it may complete a giant bullflag.
RSI is also looking weak.
Let's see if BTC continues dropping the next days...
Note
If the support in this zone breaks, the H&S pattern is still legit, technical target somewhere near the 2.618 on this chart and the 200MA from the weekly.Related publications
Disclaimer
The information and publications are not meant to be, and do not constitute, financial, investment, trading, or other types of advice or recommendations supplied or endorsed by TradingView. Read more in the Terms of Use.
Related publications
Disclaimer
The information and publications are not meant to be, and do not constitute, financial, investment, trading, or other types of advice or recommendations supplied or endorsed by TradingView. Read more in the Terms of Use.