Bitcoin (BTC/USD) 3H Chart Analysis – Bearish Continuation Setup 📉
🔍 Technical Summary:
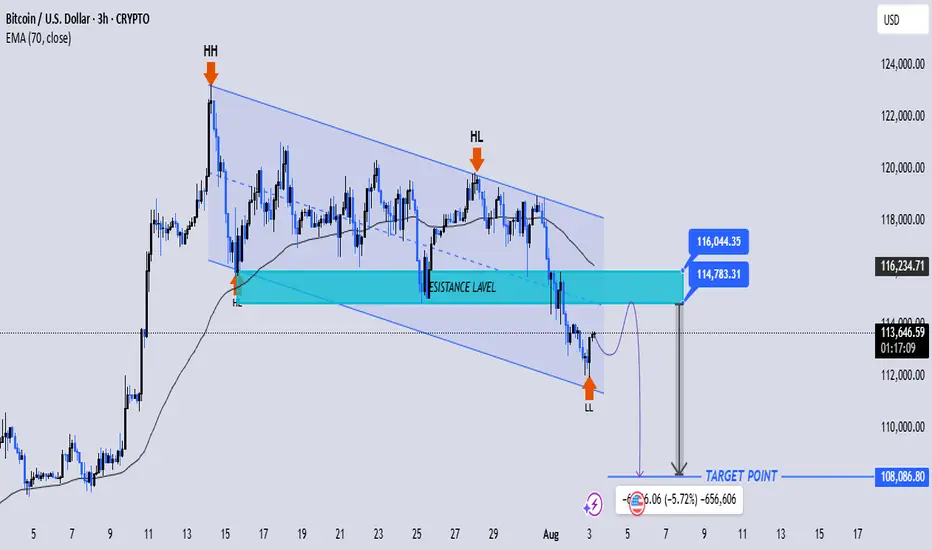
Trend: Price is moving within a descending channel (bearish structure).
Key Levels:
Resistance Zone: $114,783 – $116,044
Target Point: $108,086.80
Price Action:
Sequence of Lower Highs (HL) and Lower Lows (LL) confirms a downtrend.
Price rejected from channel resistance and EMA (70), forming HL.
Recent breakdown to new LL with potential pullback to retest resistance zone.
📊 Strategies Applied:
1. Price Action: Clear formation of HH → HL → LL indicating trend reversal and bearish continuation.
2. Support & Resistance: Strong resistance at the highlighted zone; likely retest before drop.
3. EMA Strategy: EMA 70 acting as dynamic resistance – confluence for short entries.
4. Channel Trading: Price respecting descending channel boundaries.
5. Risk/Reward: Potential short from resistance zone (~$115,000) to target ~$108,086 gives solid R:R setup.
6. Projection Tool: Measured move from resistance projects -5.72% downside.
📌 Conclusion: Bearish momentum remains strong. Watch for price to retest $114.8K–$116K zone before potential drop toward $108K target. Ideal for short setups on bearish confirmation.
🔍 Technical Summary:
Trend: Price is moving within a descending channel (bearish structure).
Key Levels:
Resistance Zone: $114,783 – $116,044
Target Point: $108,086.80
Price Action:
Sequence of Lower Highs (HL) and Lower Lows (LL) confirms a downtrend.
Price rejected from channel resistance and EMA (70), forming HL.
Recent breakdown to new LL with potential pullback to retest resistance zone.
📊 Strategies Applied:
1. Price Action: Clear formation of HH → HL → LL indicating trend reversal and bearish continuation.
2. Support & Resistance: Strong resistance at the highlighted zone; likely retest before drop.
3. EMA Strategy: EMA 70 acting as dynamic resistance – confluence for short entries.
4. Channel Trading: Price respecting descending channel boundaries.
5. Risk/Reward: Potential short from resistance zone (~$115,000) to target ~$108,086 gives solid R:R setup.
6. Projection Tool: Measured move from resistance projects -5.72% downside.
📌 Conclusion: Bearish momentum remains strong. Watch for price to retest $114.8K–$116K zone before potential drop toward $108K target. Ideal for short setups on bearish confirmation.
Trade active
Note
trade runing in profits enjoy your special profits with us and send me feedbackjoin my tellegram channel
t.me/JaMesGoldFiGhteR786
join my refferal broker
one.exnesstrack.org/a/g565sj1uo7?source=app
t.me/JaMesGoldFiGhteR786
join my refferal broker
one.exnesstrack.org/a/g565sj1uo7?source=app
Related publications
Disclaimer
The information and publications are not meant to be, and do not constitute, financial, investment, trading, or other types of advice or recommendations supplied or endorsed by TradingView. Read more in the Terms of Use.
join my tellegram channel
t.me/JaMesGoldFiGhteR786
join my refferal broker
one.exnesstrack.org/a/g565sj1uo7?source=app
t.me/JaMesGoldFiGhteR786
join my refferal broker
one.exnesstrack.org/a/g565sj1uo7?source=app
Related publications
Disclaimer
The information and publications are not meant to be, and do not constitute, financial, investment, trading, or other types of advice or recommendations supplied or endorsed by TradingView. Read more in the Terms of Use.