In the name of the Father, the Son and the Holy Spirit
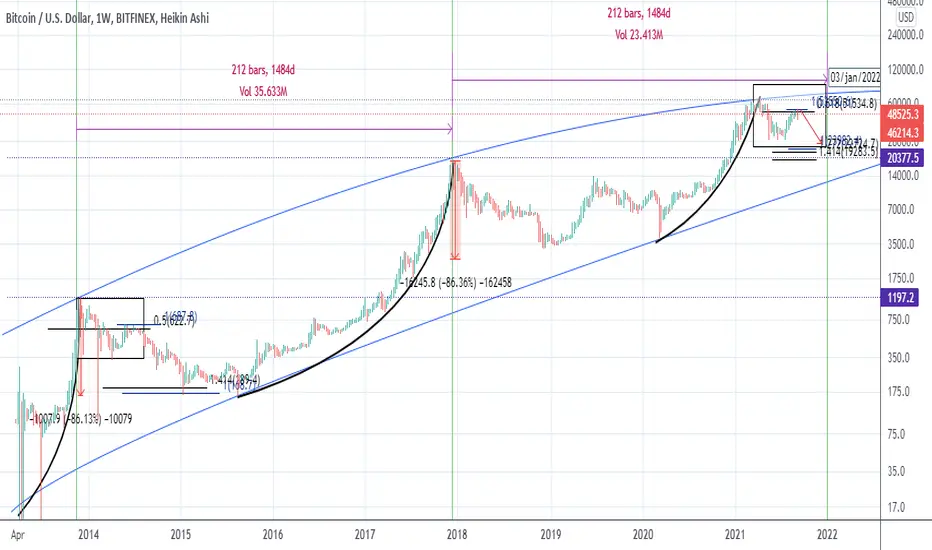
After the bitcoin ceiling in 2013 in the price range of 11 thousand
In my opinion, it is most similar to the current situation that is specified in the box.
In the price fall of 2013-2014, bitcoin reacts to the two-point and three-point Fibonacci density range (50% two-point Fibo and 100% three-point Fibonacci) after the fall, and continues to fall, forming A zigzag pattern continues.
And now, after the fall and return of the price, it reacted to the two-point and three-point Fibonacci density range (61.8% two-point Fibonacci and three three-point Fibonacci 100%). And now, if it is not stabilized above 52,000, it is prone to repeat the same behavior
If it stabilizes above 52,000, my analysis will fail and will move towards the break of the trend line.
Disclaimer
The information and publications are not meant to be, and do not constitute, financial, investment, trading, or other types of advice or recommendations supplied or endorsed by TradingView. Read more in the Terms of Use.
Disclaimer
The information and publications are not meant to be, and do not constitute, financial, investment, trading, or other types of advice or recommendations supplied or endorsed by TradingView. Read more in the Terms of Use.