Hi folks,
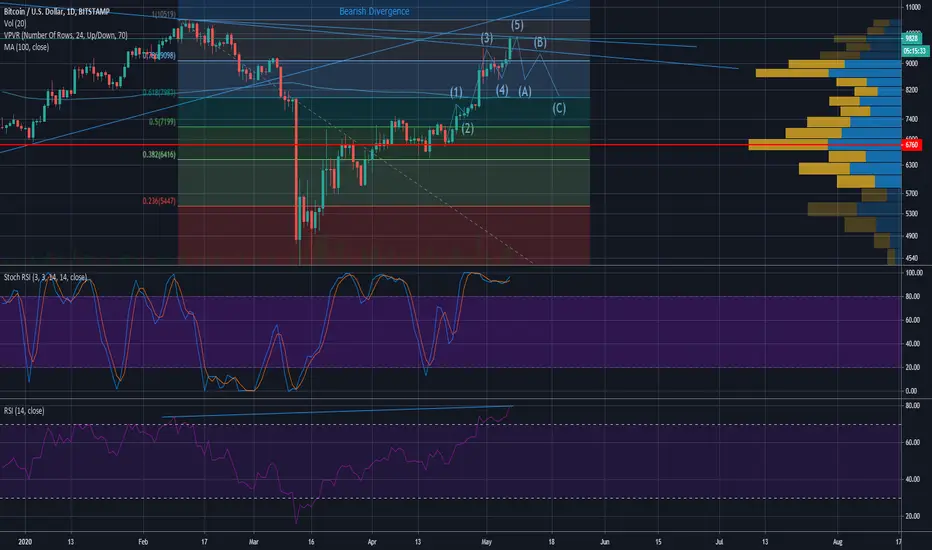
On the chart you can see the daily Bitcoin on log-scale (daily time-frame). I think right now we are completing Elliott wave 5. Bitcoin was able to break the resistance at 9.7k, but it might fall back into it again. If this happens I am confident that we start the corrective trend. So far volume seems to be lower than in wave 3 and everyone starts to think BTC is going to moon soon. This is the moment where you want to become skeptical. I want to see the momentum shifting before taking action. On the RSI we have a bearish divergence playing out when looking at the previous high at 10.5k and the price in this moment.
The correction wave A I can see going to 8.5 - 8.6k and wave C to around 8k lining up with the MA 100 and fib 0.618, which was in the previous bull runs tested before really taking off.
Happy trading everyone!
Disclaimer
The information and publications are not meant to be, and do not constitute, financial, investment, trading, or other types of advice or recommendations supplied or endorsed by TradingView. Read more in the Terms of Use.
Disclaimer
The information and publications are not meant to be, and do not constitute, financial, investment, trading, or other types of advice or recommendations supplied or endorsed by TradingView. Read more in the Terms of Use.
