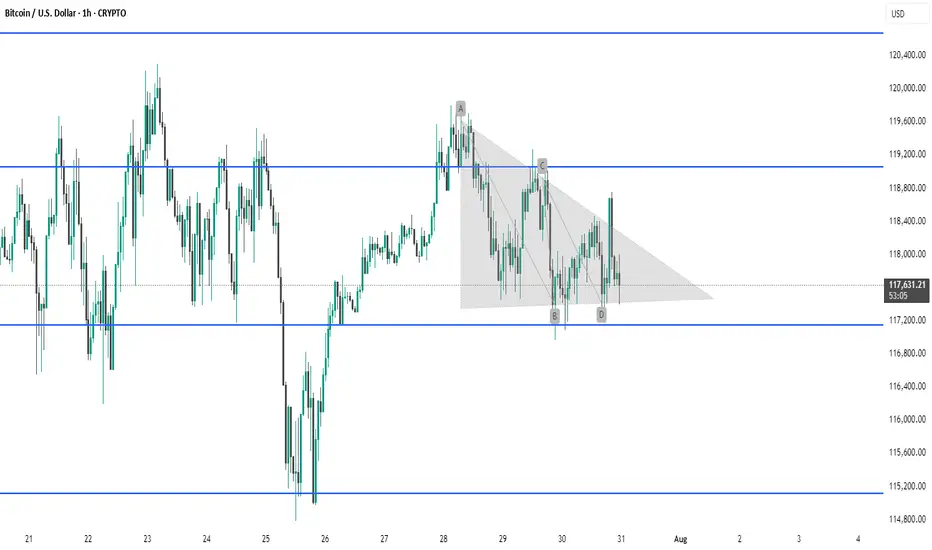
The chart displays Bitcoin (BTC/USD) on the 1-hour timeframe with clear horizontal support and resistance levels. A potential bullish harmonic pattern (likely a Bullish ABCD or Bat pattern) has formed, completing near the 117,200 support zone. Price is consolidating within a descending wedge, indicating potential reversal or breakout. Watch for a bounce from support or breakout above the wedge for bullish confirmation.
Disclaimer
The information and publications are not meant to be, and do not constitute, financial, investment, trading, or other types of advice or recommendations supplied or endorsed by TradingView. Read more in the Terms of Use.
Disclaimer
The information and publications are not meant to be, and do not constitute, financial, investment, trading, or other types of advice or recommendations supplied or endorsed by TradingView. Read more in the Terms of Use.
