🧠 BTC/USD – Falling Wedge Breakdown Indicates Bearish Continuation | Daily Timeframe
🔍 Chart Pattern: Falling Wedge (Bearish Setup Context)
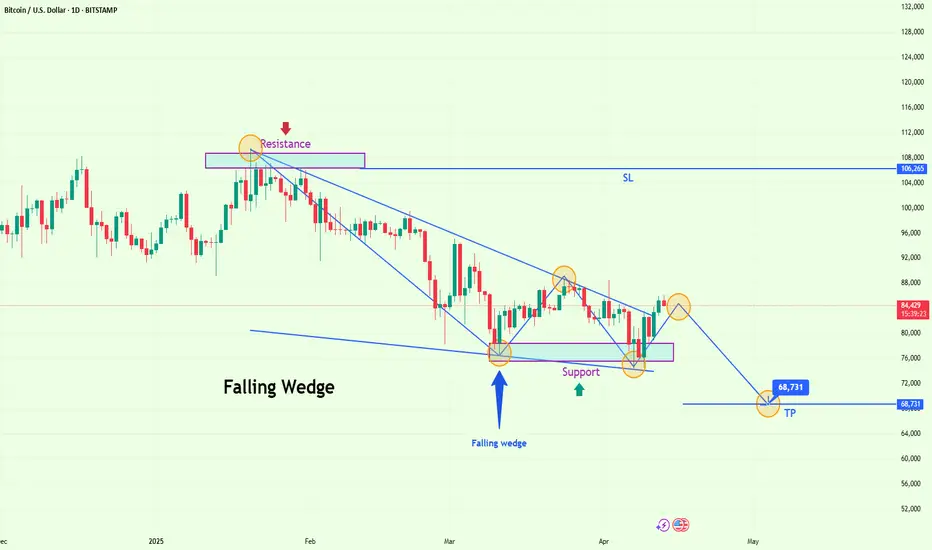
The current Bitcoin chart structure is forming a Falling Wedge pattern—typically a bullish reversal formation. However, context and price action reveal that this wedge has failed to deliver the expected bullish breakout. Instead, price action suggests a bearish continuation, supported by resistance pressure and failed attempts at bullish momentum.
🧩 Structure Components:
Upper Trendline (Resistance): Clearly defined with multiple lower highs forming a descending resistance.
Lower Trendline (Support): Established through a series of lower lows, creating a narrowing structure.
Breakout Attempt: The price briefly pierced above the wedge resistance, creating a false breakout (bull trap), followed by an immediate rejection and return to the wedge zone.
🔺 Key Resistance Level – $88,000–$90,000
This zone aligns with:
Previous horizontal resistance from mid-February and early March 2025.
The top of the wedge and the point of failed breakout.
Strong institutional sell orders are likely positioned here based on the repeated rejection wicks.
This acts as the final defense for bulls—and its inability to hold signals weakness in buyer conviction.
🔻 Key Support Level – $75,000–$76,000
This zone marks:
The bottom of the wedge and a psychological level near the mid-$70,000s.
Previously defended multiple times but with diminishing bullish volume.
A confirmed break and daily close below this zone would signal a bearish continuation, invalidating bullish recovery scenarios.
🎯 Projected Target – $68,731
Using technical measurement, the expected move from a falling wedge breakdown can be projected by measuring the height of the wedge and subtracting it from the breakout point.
Wedge height ≈ $20,000
Breakdown base ≈ $84,000
Target = $84,000 - $15,000 to $20,000 → $68,700 area
This level also aligns with minor historical support and psychological round number structure.
🧠 Market Psychology & Sentiment
This price action reflects the emotional shift in market sentiment:
Early optimism as BTC consolidated within the wedge.
Hopeful breakout attempt, where aggressive buyers entered.
Rapid reversal and rejection—a sign of institutional liquidity hunting.
Fear building as price re-enters the wedge and buyers begin exiting.
Bearish confirmation begins when the support is breached and lower lows are printed.
This sequence can create a panic-driven drop, especially if broader market sentiment is risk-off.
📊 Trading Strategy Setup
Component Details
🔹 Entry Zone $84,000 – $86,000 (after rejection confirmed)
❌ Stop Loss (SL) $106,265 – Above prior swing highs
✅ Take Profit (TP) $68,731 – Based on wedge height projection
⏳ Timeframe Daily chart – Swing trade setup
⚠️ Risk Management R:R ≈ 1:2.5+
🧭 Trade Notes & Confirmation Tools
Volume: Look for volume divergence (price rising, volume falling) during the breakout failure.
Candle Analysis: Watch for bearish engulfing or shooting star candles near resistance.
RSI/MACD: If available, bearish divergence would further validate rejection.
📌 Summary:
BTC/USD is showing signs of a failed Falling Wedge breakout. A key resistance zone around $88,000 has pushed the price back inside the wedge. With support around $75,000 under pressure, a breakdown targets the $68,731 level. Caution advised for bulls—sellers may dominate below structure. Short positions below support could offer favorable R:R setups.
🔍 Chart Pattern: Falling Wedge (Bearish Setup Context)
The current Bitcoin chart structure is forming a Falling Wedge pattern—typically a bullish reversal formation. However, context and price action reveal that this wedge has failed to deliver the expected bullish breakout. Instead, price action suggests a bearish continuation, supported by resistance pressure and failed attempts at bullish momentum.
🧩 Structure Components:
Upper Trendline (Resistance): Clearly defined with multiple lower highs forming a descending resistance.
Lower Trendline (Support): Established through a series of lower lows, creating a narrowing structure.
Breakout Attempt: The price briefly pierced above the wedge resistance, creating a false breakout (bull trap), followed by an immediate rejection and return to the wedge zone.
🔺 Key Resistance Level – $88,000–$90,000
This zone aligns with:
Previous horizontal resistance from mid-February and early March 2025.
The top of the wedge and the point of failed breakout.
Strong institutional sell orders are likely positioned here based on the repeated rejection wicks.
This acts as the final defense for bulls—and its inability to hold signals weakness in buyer conviction.
🔻 Key Support Level – $75,000–$76,000
This zone marks:
The bottom of the wedge and a psychological level near the mid-$70,000s.
Previously defended multiple times but with diminishing bullish volume.
A confirmed break and daily close below this zone would signal a bearish continuation, invalidating bullish recovery scenarios.
🎯 Projected Target – $68,731
Using technical measurement, the expected move from a falling wedge breakdown can be projected by measuring the height of the wedge and subtracting it from the breakout point.
Wedge height ≈ $20,000
Breakdown base ≈ $84,000
Target = $84,000 - $15,000 to $20,000 → $68,700 area
This level also aligns with minor historical support and psychological round number structure.
🧠 Market Psychology & Sentiment
This price action reflects the emotional shift in market sentiment:
Early optimism as BTC consolidated within the wedge.
Hopeful breakout attempt, where aggressive buyers entered.
Rapid reversal and rejection—a sign of institutional liquidity hunting.
Fear building as price re-enters the wedge and buyers begin exiting.
Bearish confirmation begins when the support is breached and lower lows are printed.
This sequence can create a panic-driven drop, especially if broader market sentiment is risk-off.
📊 Trading Strategy Setup
Component Details
🔹 Entry Zone $84,000 – $86,000 (after rejection confirmed)
❌ Stop Loss (SL) $106,265 – Above prior swing highs
✅ Take Profit (TP) $68,731 – Based on wedge height projection
⏳ Timeframe Daily chart – Swing trade setup
⚠️ Risk Management R:R ≈ 1:2.5+
🧭 Trade Notes & Confirmation Tools
Volume: Look for volume divergence (price rising, volume falling) during the breakout failure.
Candle Analysis: Watch for bearish engulfing or shooting star candles near resistance.
RSI/MACD: If available, bearish divergence would further validate rejection.
📌 Summary:
BTC/USD is showing signs of a failed Falling Wedge breakout. A key resistance zone around $88,000 has pushed the price back inside the wedge. With support around $75,000 under pressure, a breakdown targets the $68,731 level. Caution advised for bulls—sellers may dominate below structure. Short positions below support could offer favorable R:R setups.
Related publications
Disclaimer
The information and publications are not meant to be, and do not constitute, financial, investment, trading, or other types of advice or recommendations supplied or endorsed by TradingView. Read more in the Terms of Use.
Related publications
Disclaimer
The information and publications are not meant to be, and do not constitute, financial, investment, trading, or other types of advice or recommendations supplied or endorsed by TradingView. Read more in the Terms of Use.