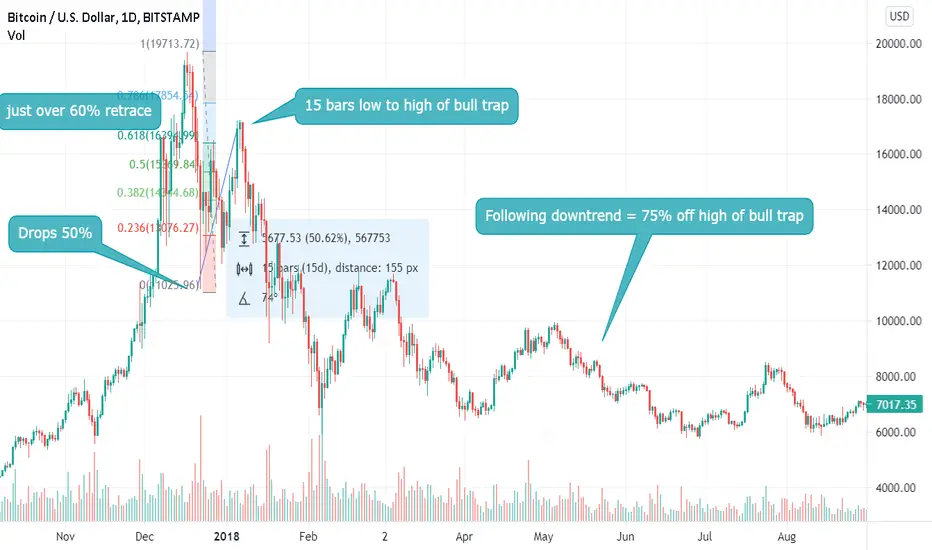
The currently weekly chart of BTC matches all the stages of the daily chart bull trap in 2017. This implies we might be on the verge of a longer lasting crash, taking five times as long as the 2017 one.
Matching points on daily 2017 and weekly 2021;
Bitcoin bulls have come to expect quick recoveries, but this might only be starting.
Matching points on daily 2017 and weekly 2021;
- 50% drop
W shaped double bottom
Into bull trap of about 15 bars
Retracement levels of 61.8%
Bitcoin bulls have come to expect quick recoveries, but this might only be starting.
We may be inside of a crash event to 3000 in SPX.
Read the full case with backlog of historic analysis/forecasts here: holeyprofitnewsletter.substack.com/p/the-case-for-3000-in-spx
Read the full case with backlog of historic analysis/forecasts here: holeyprofitnewsletter.substack.com/p/the-case-for-3000-in-spx
Related publications
Disclaimer
The information and publications are not meant to be, and do not constitute, financial, investment, trading, or other types of advice or recommendations supplied or endorsed by TradingView. Read more in the Terms of Use.