Hello and thank you for taking the time to read my analysis. Today I want to look at Bitcoin from a long-term perspective as I like to do every couple of weeks to help keep myself in check with the bigger picture.
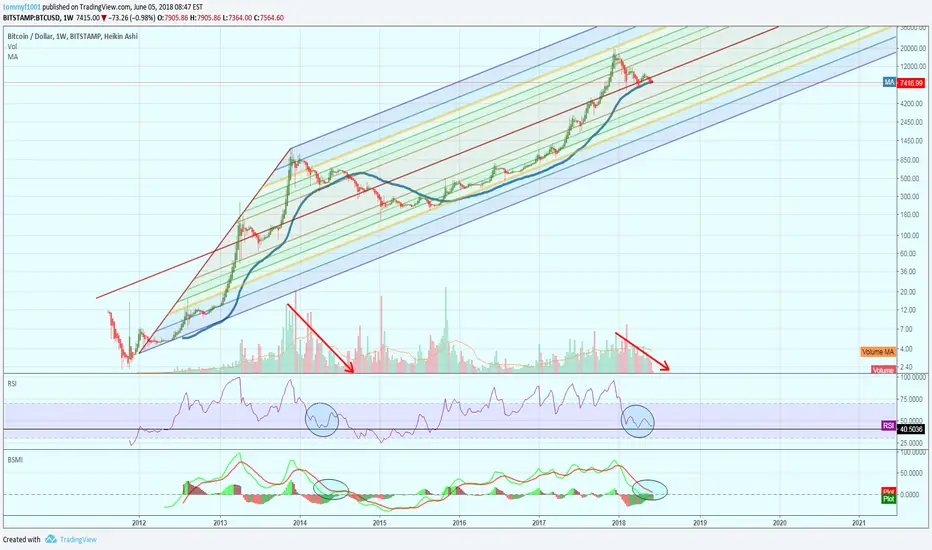
On the chart, I have applied Andrew’s Pitchfork from 2012 onwards. As far as I know, Bitstamp provides us with the longest history of Bitcoin’s price in one chart and so unfortunately we do not have the data from before 2012 on this chart.
This pitchfork channel creates very clear supports and resistances based on Fibonacci levels. The thicker gold lines in the Pitchfork represent the 0.618 retracement from the median line (dark red line). The support line for Bitcoin is clearly at the lower Golden 0.618 line which has helped keep price from dipping any lower from 2015 to 2017. If only we all had this chart set up with that support line, we would have clearly seen the price hitting resistance at the upper Golden 0.618 fib line and this is exactly where the ATH (all time high) prices hit before crashing and starting the bear market.
Looking at some indicators…The blue line on the chart represents the 50 day Moving Average on the weekly view and the price has been resting on this line since 6.4k back in early April. If we scroll back we notice the last time price was resting on it like this was in 2014 right before the price had one last surge up before continuing to fall for months after. I think a break below or push above this line will help determine longer term direction.
The RSI is showing similarities as well, with the price bouncing around the same support level it was bouncing around in 2014.
The BSMI indicator is showing some support at the zero line, but ultimately resembles the same sort of movement we saw back in 2014 as well. This indicator is based off the True Strength Indicator (TSI) with elements of LazyBear’s Squeeze Momentum Indicator and can help show trend direction as well as overbought/oversold condition.
Lastly, overall the volume has been decreasing since our peak in December. This is more apparent on the weekly view than the daily, but again we are seeing some stark similarities in 2017/18 volume to 2014 volume. With this contracting volume, we are bound to see a big break in the upcoming weeks. This could go either way, as the bulls and bears essentially come to an indecision point for the longer term direction.
I do not want to try to predict where the price is headed but I have laid out everything I am seeing right now and I will let you decide based on your own research and technical analysis where you think Bitcoin will be going for the long term. Regardless of whether Bitcoin continues the bear market or turns around to start a new bull run, the pitchfork should help with support and resistance points that can potentially act as reversal points.
Thanks again for taking your time to read this and please leave any comments or ideas below if you have any fresh perspectives to offer. And please like if you found this useful :)
Note
On the daily view, we are seeing the same type of crossover with the 50MA and 200MA after both peaks. Not a prediction of future price movement, just a simple observation of similarities between now and 2014.
Note
Something to note here: price has fallen quite a bit below the 50MA on the weekly. The last time this happened was 2014. Take it as you will...Note
Another observation worth noting: The price has been falling below the 0.618 fibonacci retracement level. This retracement was drawn from the all-time high (19.7k) all the way down to $0.00 as the 100% retracement.
I applied the same Fibonacci retracement from the 2014 peak down to $0.00.
When we look back at 2014, we see that after the 0.618 broke, there was a lot of downside until price finally settled around the 0.786 Fib level. The price never fell too far below this 0.786 fib level and in fact this is where price found solid support before beginning the next bull cycle.
I think it’s possible we see a similar outcome through 2019 as long as the price stays below the 0.618 fib level. But again, just an observation! :)
Disclaimer
The information and publications are not meant to be, and do not constitute, financial, investment, trading, or other types of advice or recommendations supplied or endorsed by TradingView. Read more in the Terms of Use.
Disclaimer
The information and publications are not meant to be, and do not constitute, financial, investment, trading, or other types of advice or recommendations supplied or endorsed by TradingView. Read more in the Terms of Use.