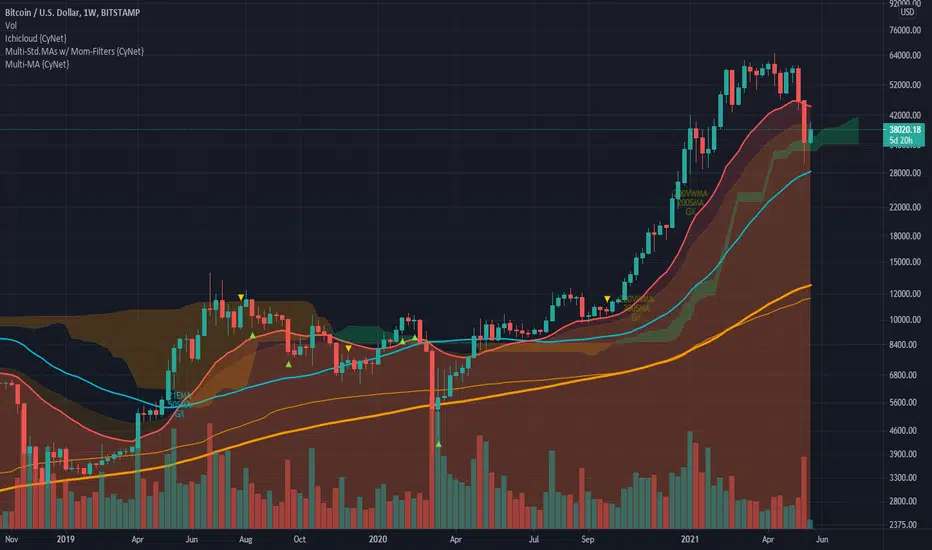
On the macro scheme of things, the recent dip looks merely like a healthy correction down to the Ichicloud (my modified settings), before bouncing off it, on the weekly chart -- rather than an onset of an early macro bear cycle.
Ichimoku Cloud (CyNet):
Speed and extend of recovery will dictate whether we are still in a macro bull market:
If BTC is able to recover strongly with the weekly candle closing above the 21 weekly EMA, perhaps even forming a bullish engulfing candle, that will bias the probability towards a bullish continuation higher (great for the Hodlers), rather than further downside towards 20k USD followed by a lengthy sideways consolidation trapped within a wide range (great swing trading opportunities for traders as well as those hoping for a second chance to buy at the previous ATH).
Side Note: There was an instance of the weekly candle closing below the red 21 weekly EMA before strongly recovering in the following week during the 2013 bull market.

Regardless of whichever the outcome may be for BTC (bullish or bearish), there are now lossa trading opportunities right now with the market moving in a more predictable way, than during the maniacal run up (better to just hold until the trend is broken).
I've been trading between BTC and selected alts atm on the way down and the bounce since the initial start of the dip below the 21 weekly EMA.[/i
Caution for the bulls with the recent recover (until BTC is able to break above the orange 200 hourly SMA next):

Could very well be a bull-trap.
Ichimoku Cloud (CyNet):
Speed and extend of recovery will dictate whether we are still in a macro bull market:
If BTC is able to recover strongly with the weekly candle closing above the 21 weekly EMA, perhaps even forming a bullish engulfing candle, that will bias the probability towards a bullish continuation higher (great for the Hodlers), rather than further downside towards 20k USD followed by a lengthy sideways consolidation trapped within a wide range (great swing trading opportunities for traders as well as those hoping for a second chance to buy at the previous ATH).
Side Note: There was an instance of the weekly candle closing below the red 21 weekly EMA before strongly recovering in the following week during the 2013 bull market.
Regardless of whichever the outcome may be for BTC (bullish or bearish), there are now lossa trading opportunities right now with the market moving in a more predictable way, than during the maniacal run up (better to just hold until the trend is broken).
I've been trading between BTC and selected alts atm on the way down and the bounce since the initial start of the dip below the 21 weekly EMA.[/i
Caution for the bulls with the recent recover (until BTC is able to break above the orange 200 hourly SMA next):
Could very well be a bull-trap.
Note
Updated Hopium for the masses (from what I had posted in my previous published chart), for it to have a chance to retest the 49.3k USD level:Note
MACD gonna cross bullish again on the daily:Note
As previously communicated:
The first resistance that BTC needs to clear to resume bullishness is the 42k USD resistance level. This is still the key level to watch IMO.
Note
(Zooming in) 4hrly chart of the 2013 bull market weekly candle dip below the weekly 21 EMA.Note
Will BTC find support and bounce off the red trendline and fulfill the inverse head-and-shoulder hopium?Ichicloud at the hourly have already turned bullish again.
Note
Still holding above the 50 hourly SMA.Note
Violent upswing probable if bullish cross in MACD is confirmed on the daily.Related publications
Disclaimer
The information and publications are not meant to be, and do not constitute, financial, investment, trading, or other types of advice or recommendations supplied or endorsed by TradingView. Read more in the Terms of Use.
Related publications
Disclaimer
The information and publications are not meant to be, and do not constitute, financial, investment, trading, or other types of advice or recommendations supplied or endorsed by TradingView. Read more in the Terms of Use.