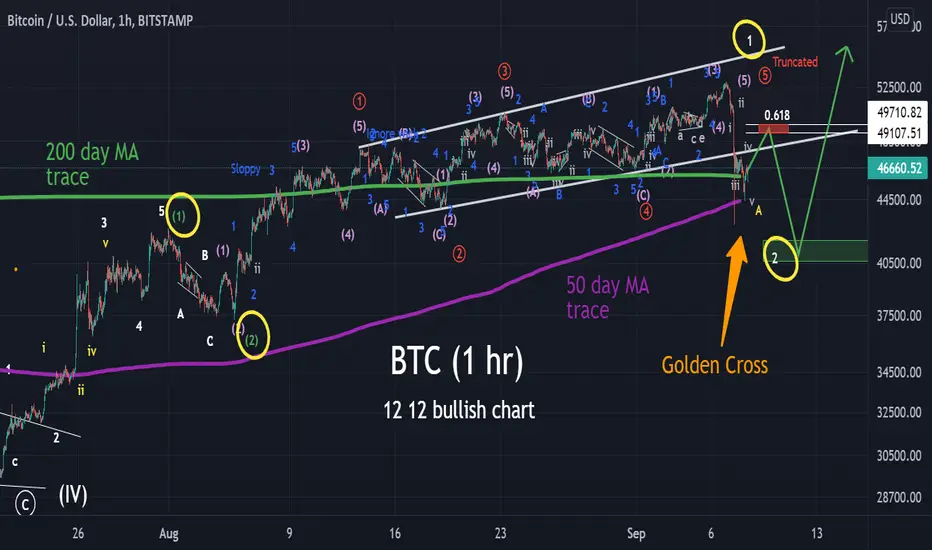
I show BTC has forming a 1-2 1-2 wave pattern so far. This would be a very bullish scenario.
Also bullish, is that that 50 day is about to intersect the 200 day MA for a golden cross.
I traced over my 200 and 50 day MA on a daily chart so that the lines would stay in place when I switched to hourly.
The leading diagonal is a 5-3-5-3-5 type.
The last red wave 5 of the diagonal is truncated, as traders front ran it. (Sold early)
For Elliott people, the last red wave 5 has a blue wave 3 that is barely longer than blue wave 1, plus a small blue 5. Makes sense as it is a truncated wave.
For the heck of it, using the info so far, I also I created a rough road map of where BTC could top at in the chart below.
Note
Here is a rough road map of BTC to the top. It puts the top in the same ball park as the well known historical 2011 to 2021 curve trend of BTC.Note
I corrected a triangle in subwave 2 of my red 5. I changed it to a wxyxz as triangles can't be in a wave 2.I've been told that wave 1 cannot be the longest for an expanding diagonal, so the whole chart might be trash. Sorry.
Disclaimer
The information and publications are not meant to be, and do not constitute, financial, investment, trading, or other types of advice or recommendations supplied or endorsed by TradingView. Read more in the Terms of Use.
Disclaimer
The information and publications are not meant to be, and do not constitute, financial, investment, trading, or other types of advice or recommendations supplied or endorsed by TradingView. Read more in the Terms of Use.