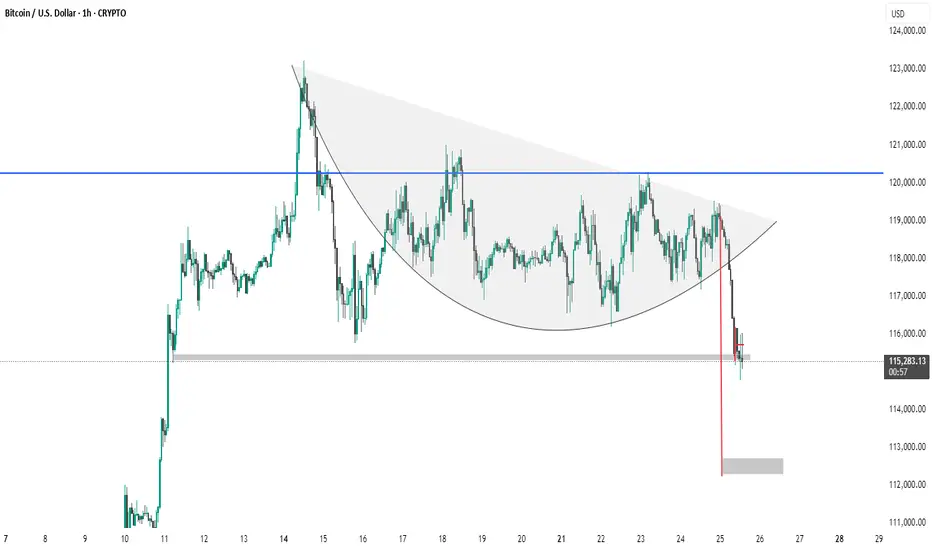
The chart shows a bearish breakdown from a rounded top formation, indicating a shift from an uptrend to a downtrend in Bitcoin (BTC/USD) on the 1-hour timeframe. Price broke below a key support zone ($116,000), confirmed by a sharp red candle. The shaded area below ($112,500) suggests the next potential support or target zone. This pattern reflects weakening bullish momentum and possible further downside.
Disclaimer
The information and publications are not meant to be, and do not constitute, financial, investment, trading, or other types of advice or recommendations supplied or endorsed by TradingView. Read more in the Terms of Use.
Disclaimer
The information and publications are not meant to be, and do not constitute, financial, investment, trading, or other types of advice or recommendations supplied or endorsed by TradingView. Read more in the Terms of Use.