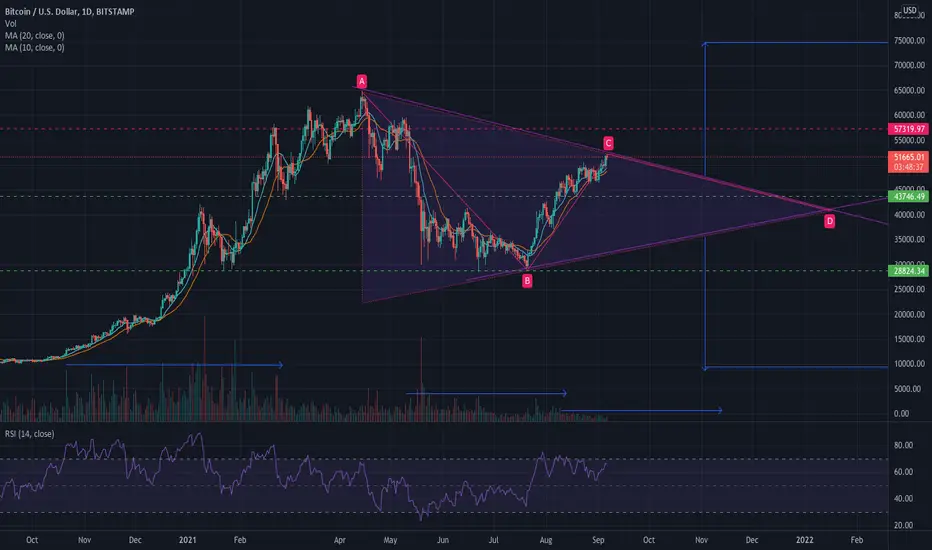
Bitcoin looks like its forming a triangle here with three points and on its way to point four.
It will either break up towards $75k or down to about $10k.
Notice the strong support on$44k, $29k and strong resistance on $57k.
Also see volume levels that took it from $10k to over $60k, and second volume level that took it from $29k to now about $51.5k, compared to current volume levels.
Thanks
It will either break up towards $75k or down to about $10k.
Notice the strong support on$44k, $29k and strong resistance on $57k.
Also see volume levels that took it from $10k to over $60k, and second volume level that took it from $29k to now about $51.5k, compared to current volume levels.
Thanks
Note
Bitcoin did test the support line at about$44k and still shows signs of weakness, might test $37k line that is a stronger one.Note
Bitcoin to test support line at $37,332 by Oct 25 2021.Disclaimer
The information and publications are not meant to be, and do not constitute, financial, investment, trading, or other types of advice or recommendations supplied or endorsed by TradingView. Read more in the Terms of Use.
Disclaimer
The information and publications are not meant to be, and do not constitute, financial, investment, trading, or other types of advice or recommendations supplied or endorsed by TradingView. Read more in the Terms of Use.