BTC/USD 1-hour chart analysis, here's a detailed sell setup based on the Bearish Wedge pattern breakdown:
🔻 Sell Analysis – BTC/USD (1H Timeframe)
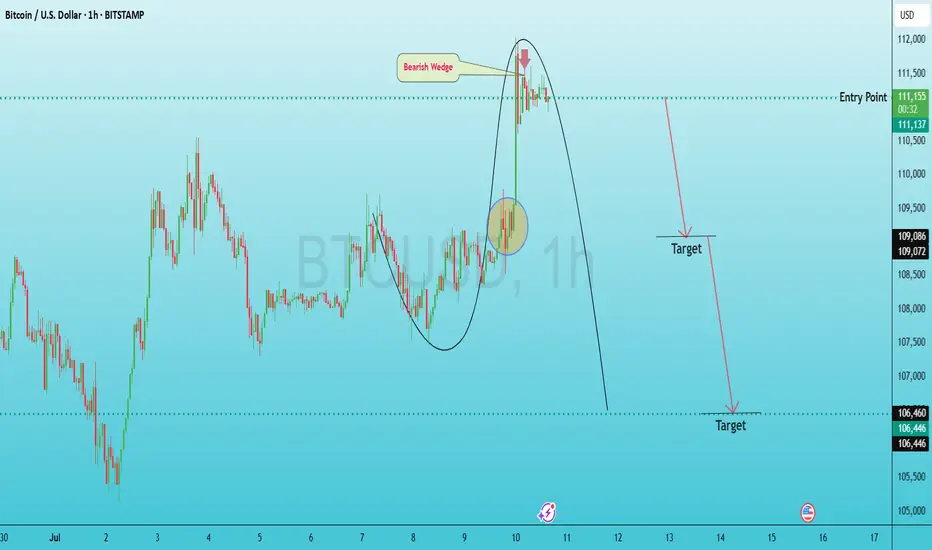
Pattern Identified: Bearish Wedge (Rising Wedge, breakdown expected)
Current Price Zone: Around $110,990
✅ Sell Entry:
Around $111,000
(Price has broken out of the wedge and retraced close to entry zone)
🎯 Take Profits (TPs):
1. TP1: $109,080 (near the first support zone shown in the chart)
2. TP2: $106,460 (final target in the chart, previous demand zone and wedge base)
🛑 Stop Loss (SL):
$111,900 (Above recent high and wedge top to protect against false breakout)
📊 Risk-Reward Summary:
Entry: $111,000
SL: $111,800
TP1: $109,080 → ~+1920 pips
TP2: $106,460 → ~+4540 pips
Risk: ~800 pips
R:R Ratio:
TP1: ~2.4:1
TP2: ~5.7:1
🔎 Additional Notes:
Ensure confirmation through volume drop or a strong bearish candle at/near entry.
Consider adjusting SL to breakeven once TP1 is hit.
🔻 Sell Analysis – BTC/USD (1H Timeframe)
Pattern Identified: Bearish Wedge (Rising Wedge, breakdown expected)
Current Price Zone: Around $110,990
✅ Sell Entry:
Around $111,000
(Price has broken out of the wedge and retraced close to entry zone)
🎯 Take Profits (TPs):
1. TP1: $109,080 (near the first support zone shown in the chart)
2. TP2: $106,460 (final target in the chart, previous demand zone and wedge base)
🛑 Stop Loss (SL):
$111,900 (Above recent high and wedge top to protect against false breakout)
📊 Risk-Reward Summary:
Entry: $111,000
SL: $111,800
TP1: $109,080 → ~+1920 pips
TP2: $106,460 → ~+4540 pips
Risk: ~800 pips
R:R Ratio:
TP1: ~2.4:1
TP2: ~5.7:1
🔎 Additional Notes:
Ensure confirmation through volume drop or a strong bearish candle at/near entry.
Consider adjusting SL to breakeven once TP1 is hit.
JOIN MY TELEGRAM:
FREE SIGNALS TECHNICAL CHART AND EDUCATOIN
t.me/+j_sv6p9sL5I0MDY0
FREE SIGNALS TECHNICAL CHART AND EDUCATOIN
t.me/+j_sv6p9sL5I0MDY0
Disclaimer
The information and publications are not meant to be, and do not constitute, financial, investment, trading, or other types of advice or recommendations supplied or endorsed by TradingView. Read more in the Terms of Use.