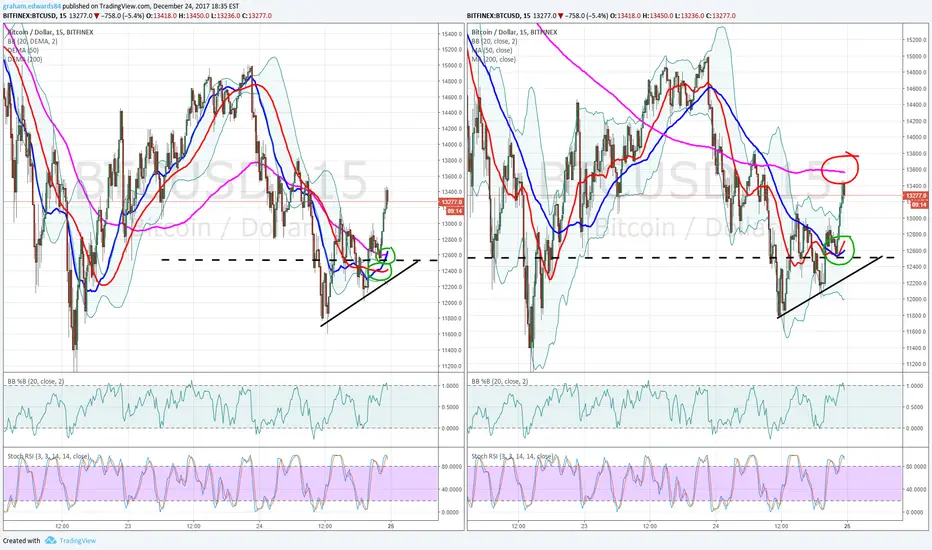
My findings indicate that while the DEMA can be an early indicator of a bullish cross it is not accurate. On the left in the DEMA chart, the green circle showed the 50 DEMA crossing up through the 20 DEMA caused a spike in price point... which is just weird because it should have gone the other way because it is actually the 20 moving down through the 50... and in the second green circle when the 50 DEMA moved up through the 200 DEMA it actually coincided with a stop in the rally spike which is also undesirable.
On the right side chart using Simple Moving Averages (SMAs) you can see that the 20 SMA moving up through the 50 SMA caused a very predictable spike and not only that but the 200 SMA also provided a reasonably accurate target point to exit. In addition, as you can see form these two charts, the SMA chart side shows much better support resistance correlation on all of the averages with the price point.
Conclusion... So I'm not seeing any advantage to using DEMAs at this point over SMAs but perhaps on a different time scale chart there may be better results so I will research this a little longer.
Note

notes if you click on the chart
Disclaimer
The information and publications are not meant to be, and do not constitute, financial, investment, trading, or other types of advice or recommendations supplied or endorsed by TradingView. Read more in the Terms of Use.
Disclaimer
The information and publications are not meant to be, and do not constitute, financial, investment, trading, or other types of advice or recommendations supplied or endorsed by TradingView. Read more in the Terms of Use.