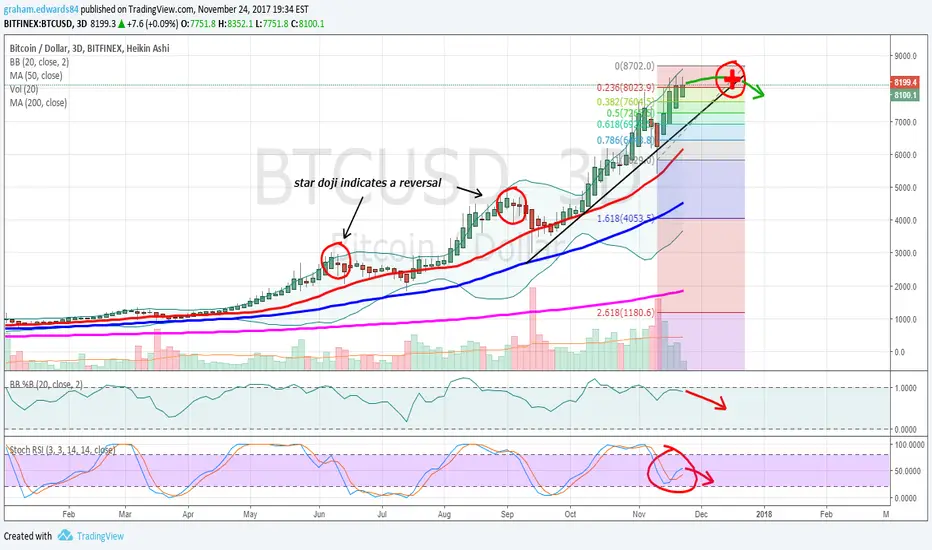
Looking at BTCUSD on this 3 day chart we can see that previous reversals have been indicated by star dojis. But now we are not seeing this yet. This leads me to believe that there will be some sideways consolidation at the top that is yet to come as this relatively stable price points will produce the doji on longer time frames such as this three day chart.
Indicators at the bottom are also displaying some bearish signs although hard to pinpoint movements using indicators at this time frame it does look a bit bearish. It will be interesting to see here if bitcoin can muster a sideways rising consolidation or a falling one and will there be a considerable fall to previous support levels or will it be a relatively smooth mostly sideways move?
Generally after the third wave in the series there is some type of correction to a previous wave top so we could be looking at the 500 range as a good entry target if this happens.
Disclaimer
The information and publications are not meant to be, and do not constitute, financial, investment, trading, or other types of advice or recommendations supplied or endorsed by TradingView. Read more in the Terms of Use.
Disclaimer
The information and publications are not meant to be, and do not constitute, financial, investment, trading, or other types of advice or recommendations supplied or endorsed by TradingView. Read more in the Terms of Use.