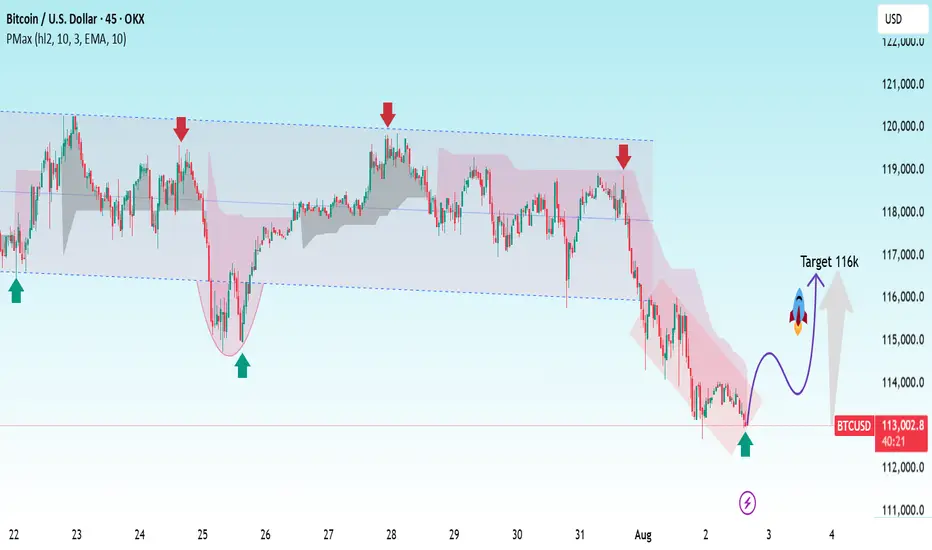
Bitcoin (BTC/USD) has recently broken out of a downward channel near the $113K support level, suggesting a potential bullish reversal. After consolidating within a horizontal range and forming a rounded bottom pattern, BTC appears set to target the $116K resistance zone. The chart indicates buying momentum may return, with the projected price path showing a bullish breakout supported by technical indicators and previous support bounces. Traders should watch for confirmation of the breakout and volume increase before entering long positions.
Trend Overview:
Current Price: ~$113,004
Timeframe: 45-min chart (short-term outlook)
Exchange: OKX
Indicators Used: PMax (custom EMA-based trend filter)
---
📉 Price Action & Structure:
Range Formation: BTC traded in a sideways channel between ~113K and ~119K from July 22 to July 31.
Rejection Points: Multiple upper rejections (~119K, marked with red arrows) indicate strong resistance.
Support Touches: Price bounced from ~113K several times (green arrows), confirming a solid support zone.
---
☕ Bullish Reversal Signals:
1. Falling Wedge/Channel Breakout Expected:
BTC is currently inside a descending channel.
A breakout from this pattern near the bottom (~113K zone) is suggested by the purple path and green arrow.
2. Rounded Bottom Formation:
A “cup”-like shape formed on July 25-26, often a bullish reversal pattern.
Trade active
Clean charts | 🔍 Deep analysis | 📈 Consistent setups”
MY FREE FOREX &CRYPTO SIGNALS TELEGRAM CHANNEL:
t.me/+4KSkqllbBldiZDY8
MY FREE FOREX &CRYPTO SIGNALS TELEGRAM CHANNEL:
t.me/+4KSkqllbBldiZDY8
Disclaimer
The information and publications are not meant to be, and do not constitute, financial, investment, trading, or other types of advice or recommendations supplied or endorsed by TradingView. Read more in the Terms of Use.