In this publish I will be taking a deep dive into BTC and it's historical data that may give clues to its future whereabouts/performance. I will be using the Fibonacci extension and retracement tool with "logarithmic mode on" in the settings, as well as logarithmic mode enable on the chart.
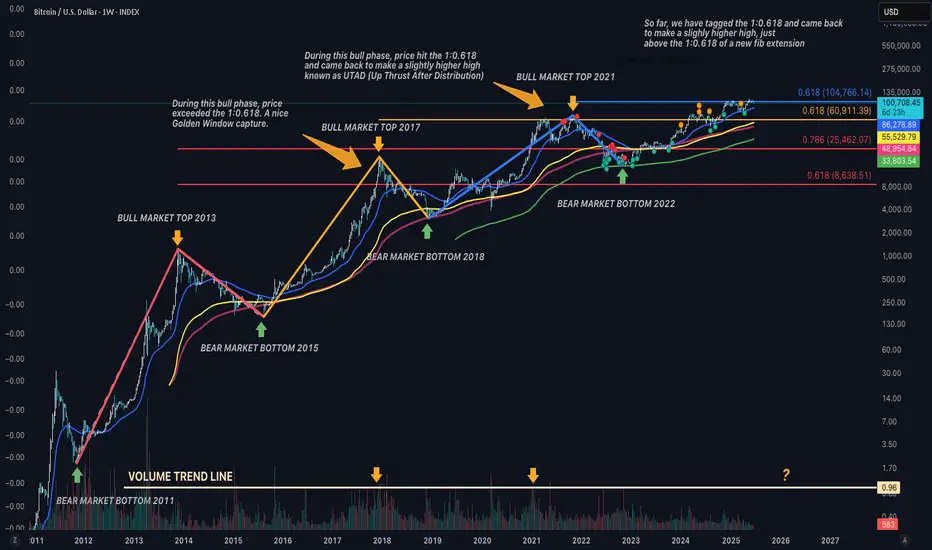
In the above chart; I have fibonacci extension levels plotted that are based from pivots of bear market bottom to bull market top, then back to next bear market bottom. This will capture the entire performance of each cycle to give the next projected top. Each fib level is color coordinated to the pivots it has been projected from.
Taking a look at the bull market top of 2017: Price reached well above the 1:0.618 and inside the 1:0.786, this was a nice golden window (inside the 0.618 and 0.786 level) capture here. It was a single top with no confusion about it.
Next, the bull market top of 2021: Price printed a shooting star through the 1:0.618 and came back to make a slightly higher high, which is a "Wyckoff Distribution Event" known as UTAD (Up Thrust After Distribution). Notice the bear market that followed; price found support on the 500 EMA (green ribbon) rather than the 200 SMA (maroon ribbon) as it did the previous bear market. This suggests a loss of momentum.
Now, Looking at price action that has printed since the beginning of 2025, price hit the 1:0.618
back in January and came back to print a slightly higher high in May, marking a potential UTAD event.
So, questions arise, is BTC topping in this area? And, could this cycle be coming to an end?
I do believe we will see pull back, a possible "Mini Distribution" event. And I say mini distribution because during previous bull market tops, volume has peaked and tagged the volume trend line that I have plotted at the bottom of the chart. So far, since the last bear market, volume has been weak and hasn't come close to tagging that area, even despite the substantial increase in BTC.D.
On another note: a possible "Black Swan" event. The last black swan event was the COVID-19 pandemic; Price went from $13,870 down to $3,880, approx. a 72% drop. That is close to the percentage loss of bear markets. 👇👇👇
During the crash, price tagged the 0:1.618 window of a reverse fib retracement, and what followed was a nice "V-shape" recovery (Bullish Engulf on a higher time frame). So, this shows that the market can recover strong after a global pandemic and rather quickly.
Assuming that this a wave top that has printed recently, and assuming that this could evolve into a black swan event, we could predict that BTC could tag the higher time frame 0:1.618 again, based off of historical data. If this be the case, it would be approx. a 50% drop in value, bringing BTC close to mid 50K price range. 👇👇👇
If support were to break at that level, it could result in the start of a bear market, and possibly, that price could tango with the 500 EMA (Green Ribbon) yet again.
So, this is a very dangerous area here, given the technicals. Perhaps the bears may have a ball here.
Let's take a closer look through the smaller time frame 1D chart: Within March and April - price found support at the lower time frame 0:1.618, plotted with a reverse fib retracement. 👇👇👇
We have a similar topping pattern here since printing the slightly higher ATH. Given the bullish wick that printed yesterday (Green Arrow Markup), we could assume that a minor wave up could be baking. If it indeed cooks and rejection were to occur around the $104,766 level, this may be an indication that continuation to the downside will resume.
The next key level of support is the LTF 0:1.618 window, roughly between 92-93K. If support breaks at that level, this increases the chance that the higher time frame 0:1.618 (mid 50K) will be the stomping grounds.
KEY TAKEAWAY: If price were to make a bounce back up; look for rejection at the $104,766 level. If continuation to the downside resumes thereafter, look for support at 92-93K. If support were to break there, this increases the chance that price could retrace to the mid 50K range. If it collapses at 50K, say hello to bear market with price around the 500 EMA on the 1W chart.
Good Luck Traders!
-Not Financial Advice-
Disclaimer
The information and publications are not meant to be, and do not constitute, financial, investment, trading, or other types of advice or recommendations supplied or endorsed by TradingView. Read more in the Terms of Use.
Disclaimer
The information and publications are not meant to be, and do not constitute, financial, investment, trading, or other types of advice or recommendations supplied or endorsed by TradingView. Read more in the Terms of Use.