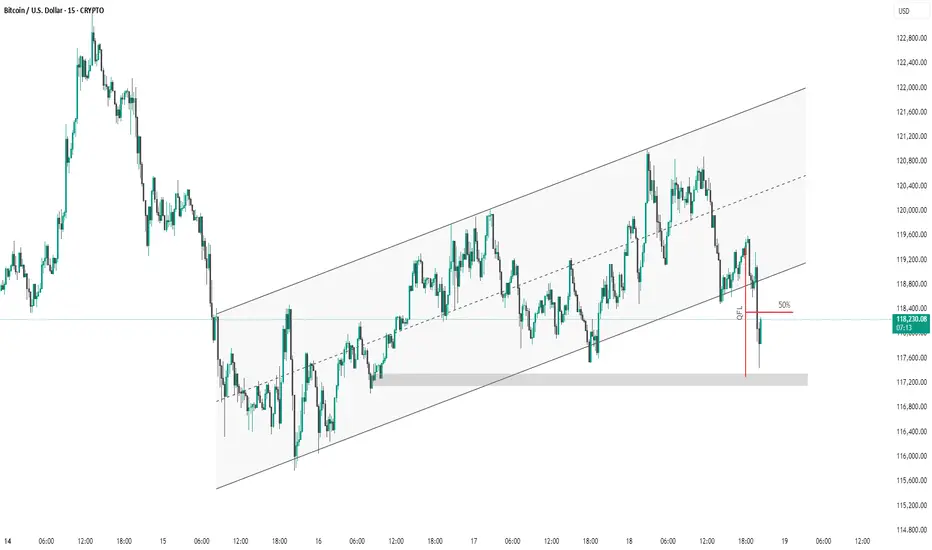
This 15-minute BTC/USD chart shows price action within an ascending channel. Recently, Bitcoin broke below the channel's midline and dipped to a key demand zone (highlighted in grey), triggering a liquidity grab (marked as "GFL"). Price has since retraced to the 50% level of the drop, which may act as resistance. A failure to reclaim the channel could indicate further downside.
Related publications
Disclaimer
The information and publications are not meant to be, and do not constitute, financial, investment, trading, or other types of advice or recommendations supplied or endorsed by TradingView. Read more in the Terms of Use.
Related publications
Disclaimer
The information and publications are not meant to be, and do not constitute, financial, investment, trading, or other types of advice or recommendations supplied or endorsed by TradingView. Read more in the Terms of Use.