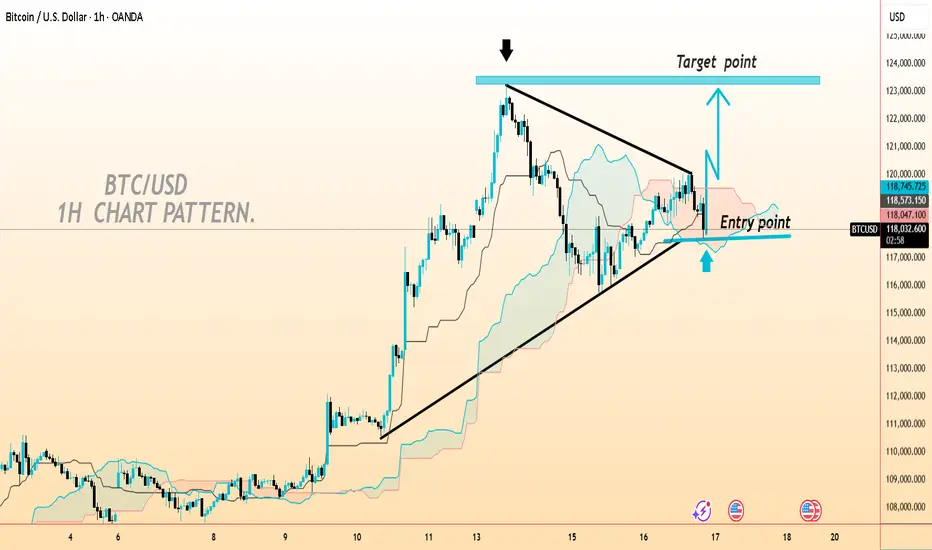
The chart you provided is a BTC/USD 1-hour chart pattern, and it appears to be forming a symmetrical triangle or a pennant pattern, which is typically a continuation pattern in technical analysis. Here’s a detailed breakdown:
Key Observations
1. Pattern Formation
The price has been consolidating between two converging trendlines after a strong upward move.
This creates a bullish pennant, suggesting the potential for a breakout in the direction of the previous trend (upward).
2. Entry Point
The chart marks an Entry point near the lower trendline (around $117,916).
This suggests buying near support within the pattern before a breakout.
3. Target Point
The target is projected upward, beyond $122,000, based on the height of the initial bullish move (flagpole) added to the breakout level.
4. Indicators
There is an Ichimoku Cloud shown, indicating near-term support around the entry point.
Price currently is just above the cloud, which can act as additional support.
Trading Idea
Bullish Scenario: If BTC breaks above the upper trendline ($122,000).
Bearish Scenario: If price falls below the lower trendline (~$117,500), the bullish pattern fails, and a deeper retracement is possible.
Risk Management
Stop-loss: Below $117,000 (below lower trendline and cloud support).
Take-profit: Around $122,000 (target zone).
---
✅ Do you want me to:
Draw the breakout scenario with stop-loss and take-profit clearly marked?
Calculate the exact risk/reward ratio for this trade?
Provide a short-term BTC forecast based on current technicals?
Trade active
Trade activeTrade closed: target reached
5000 pips target done Join telegram free...
t.me/moneymagnet0782
Forex Gold & Crypto Signals with
detailed analysis & get consistent |
result ...
Gold Signals with peoper TP & SL for
high profit ...
t.me/moneymagnet0782
t.me/moneymagnet0782
Forex Gold & Crypto Signals with
detailed analysis & get consistent |
result ...
Gold Signals with peoper TP & SL for
high profit ...
t.me/moneymagnet0782
Disclaimer
The information and publications are not meant to be, and do not constitute, financial, investment, trading, or other types of advice or recommendations supplied or endorsed by TradingView. Read more in the Terms of Use.
Join telegram free...
t.me/moneymagnet0782
Forex Gold & Crypto Signals with
detailed analysis & get consistent |
result ...
Gold Signals with peoper TP & SL for
high profit ...
t.me/moneymagnet0782
t.me/moneymagnet0782
Forex Gold & Crypto Signals with
detailed analysis & get consistent |
result ...
Gold Signals with peoper TP & SL for
high profit ...
t.me/moneymagnet0782
Disclaimer
The information and publications are not meant to be, and do not constitute, financial, investment, trading, or other types of advice or recommendations supplied or endorsed by TradingView. Read more in the Terms of Use.