🔹 Current Market Context:
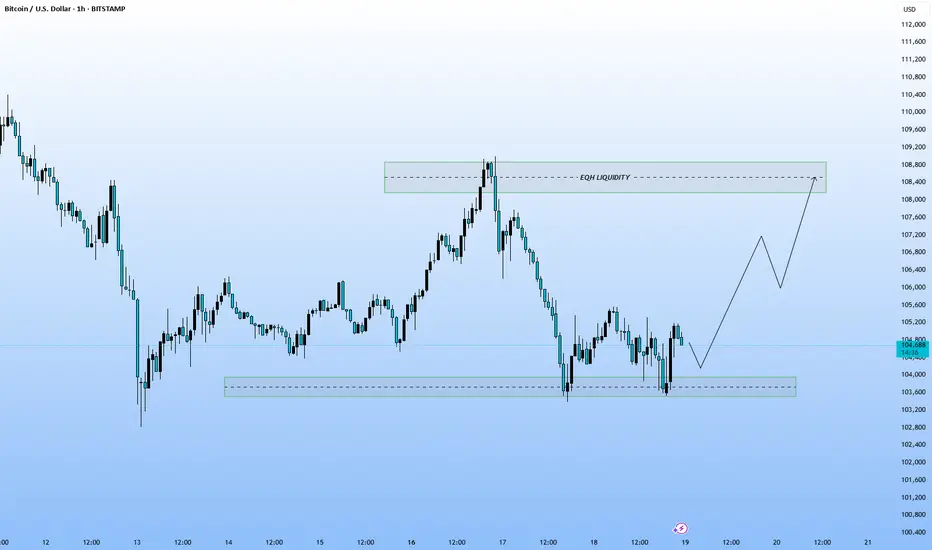
The market had a strong bearish move (left side of the chart), followed by a retracement and consolidation.
Current price: Around 104,700
Market is possibly forming a reversal structure after a significant low sweep.
🔹 Key Zones Marked:
Demand Zone (lower green box):
Support area around ~103,600–104,000 where price tapped and bounced — likely indicating accumulation or mitigation zone.
Equal Liquidity Zone (upper green box):
Marked near 107,800–108,000, labeled as "EQH LIQUIDITY" — this is a potential bullish target, where stop-losses of sellers might be sitting.
📈 Expected Price Action (Illustrated Path):
Short-Term Dip:
A minor pullback is expected towards the demand zone again.
Bullish Reversal:
After this potential retest, a strong bullish move is anticipated.
Liquidity Target:
Price is projected to rally up and sweep the equal highs or liquidity zone.
🔍 Technical View:
Structure Type: Smart Money/Price Action-based.
Concepts Used: Demand zone, Liquidity sweep (EQH), Accumulation, Market Structure Shift.
Bullish Bias: The projection suggests a trend reversal setup.
📝 Conclusion:
This chart forecasts a bullish reversal setup for BTC/USD:
Buy setup from demand zone (~104,000)
Targeting liquidity at 107,800–108,000
Disclaimer
The information and publications are not meant to be, and do not constitute, financial, investment, trading, or other types of advice or recommendations supplied or endorsed by TradingView. Read more in the Terms of Use.
Disclaimer
The information and publications are not meant to be, and do not constitute, financial, investment, trading, or other types of advice or recommendations supplied or endorsed by TradingView. Read more in the Terms of Use.