In the world of trading, there's a fundamental divide between traders who rely on subjective interpretation and those who trust mathematical precision. While concepts like ICT (Inner Circle Trader), SMC (Smart Money Concepts), and naked chart analysis have gained popularity, they all share one critical flaw: they're based entirely on personal interpretation.
The Subjectivity Problem
Ask ten ICT traders to mark their Order Blocks, Fair Value Gaps, or Breaker Blocks on the same chart, and you'll get ten different answers. Why? Because these concepts rely on:
Personal bias in identifying "significant" levels
Subjective interpretation of market structure
Discretionary decision-making on what constitutes a valid setup
Emotional influence on analysis
The same issue plagues SMC, CRT (Candle Range Theory), time-based analysis, and naked chart trading. One trader's "liquidity grab" is another trader's "breakout." One person's "strong support" is another's "weak bounce zone."
The Mathematical Solution
This indicator eliminates this guesswork entirely. Instead of relying on subjective interpretation, it:
Calculates exact entry levels using mathematical formulas based on session params
Identifies precise support/resistance zones
Standardises signals across all timeframes, ensuring consistency whether you're on 1m or 15m charts
Removes emotional bias by using algorithmic detection of significant price levels
Numbers Don't Lie
While an ICT trader might debate whether a level is "mitigation" or "inducement," our indicator simply states: "Entry at 1.0847, Stop at 1.0832." No interpretation needed. No second-guessing. Just mathematical precision derived from actual price action.
The Inside Range Advantage: When Zones Within Zones Create Superior Trading Opportunities
Most traders miss one of the most powerful setups in technical analysis: the Inside Range (IR). While ICT traders debate "nested order blocks" and SMC followers argue about "refined zones," you can easily identify Inside Ranges with this indicator and mathematically identify these high-probability setups with zero ambiguity.
What Makes Inside Ranges Special?
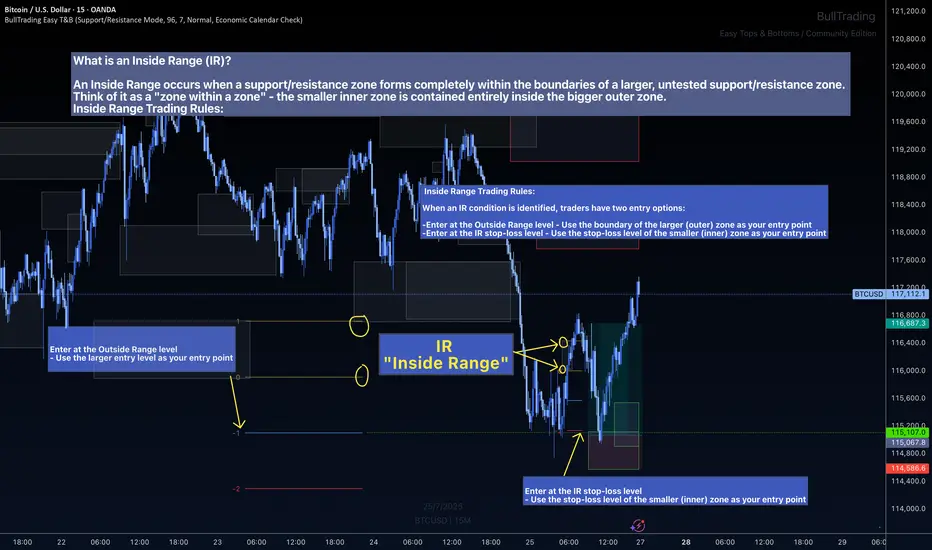
An Inside Range occurs when a new support/resistance zone forms completely within an untested larger zone. Think of it as the market revealing its hand twice – first showing you the broader area of interest, then pinpointing the precise level within it.
The Mathematical Edge
While discretionary traders struggle to identify these setups consistently, this indicator:
Automatically detects when a smaller zone forms within a larger untested zone
Calculates two precise entry options without any guesswork
Eliminates the confusion of nested levels that plague subjective analysis
Two Entries, Zero Confusion
Documentation and full trading system instructions can be found on the indicator's publication
When an IR forms, the indicator provides exactly two mathematically-derived entry options:
The Outside Range entry – Using the larger zone's entry level
The IR Stop-Loss entry – Converting the inner zone's stop level into an entry point
Compare this to SMC's "refined OB" or ICT's "nested FVG" concepts where traders endlessly debate which level is valid. With Inside Ranges, there's no debate – just two clear, calculated levels.
Inside Ranges represent areas where institutional interest overlaps. The larger zone shows initial interest, while the smaller zone within reveals refined positioning. By mathematically identifying these setups, you're trading where smart money has shown its hand twice.
Real Consistent Precision
Instead of squinting at charts trying to identify subjective "zones within zones," let mathematics do the heavy lifting.
In trading, consistency beats creativity. Stop drawing arbitrary lines and hoping for the best. Start trading with mathematical precision.
Documentation and full trading system instructions can be found on the indicator's publication → https://www.tradingview.com/script/5sSpi7wR-BullTrading-Easy-Tops-Bottoms/
Trade with confidence. Trust in mathematics. Trust in your Edge.
The Subjectivity Problem
Ask ten ICT traders to mark their Order Blocks, Fair Value Gaps, or Breaker Blocks on the same chart, and you'll get ten different answers. Why? Because these concepts rely on:
Personal bias in identifying "significant" levels
Subjective interpretation of market structure
Discretionary decision-making on what constitutes a valid setup
Emotional influence on analysis
The same issue plagues SMC, CRT (Candle Range Theory), time-based analysis, and naked chart trading. One trader's "liquidity grab" is another trader's "breakout." One person's "strong support" is another's "weak bounce zone."
The Mathematical Solution
This indicator eliminates this guesswork entirely. Instead of relying on subjective interpretation, it:
Calculates exact entry levels using mathematical formulas based on session params
Identifies precise support/resistance zones
Standardises signals across all timeframes, ensuring consistency whether you're on 1m or 15m charts
Removes emotional bias by using algorithmic detection of significant price levels
Numbers Don't Lie
While an ICT trader might debate whether a level is "mitigation" or "inducement," our indicator simply states: "Entry at 1.0847, Stop at 1.0832." No interpretation needed. No second-guessing. Just mathematical precision derived from actual price action.
The Inside Range Advantage: When Zones Within Zones Create Superior Trading Opportunities
Most traders miss one of the most powerful setups in technical analysis: the Inside Range (IR). While ICT traders debate "nested order blocks" and SMC followers argue about "refined zones," you can easily identify Inside Ranges with this indicator and mathematically identify these high-probability setups with zero ambiguity.
What Makes Inside Ranges Special?
An Inside Range occurs when a new support/resistance zone forms completely within an untested larger zone. Think of it as the market revealing its hand twice – first showing you the broader area of interest, then pinpointing the precise level within it.
The Mathematical Edge
While discretionary traders struggle to identify these setups consistently, this indicator:
Automatically detects when a smaller zone forms within a larger untested zone
Calculates two precise entry options without any guesswork
Eliminates the confusion of nested levels that plague subjective analysis
Two Entries, Zero Confusion
Documentation and full trading system instructions can be found on the indicator's publication
When an IR forms, the indicator provides exactly two mathematically-derived entry options:
The Outside Range entry – Using the larger zone's entry level
The IR Stop-Loss entry – Converting the inner zone's stop level into an entry point
Compare this to SMC's "refined OB" or ICT's "nested FVG" concepts where traders endlessly debate which level is valid. With Inside Ranges, there's no debate – just two clear, calculated levels.
Inside Ranges represent areas where institutional interest overlaps. The larger zone shows initial interest, while the smaller zone within reveals refined positioning. By mathematically identifying these setups, you're trading where smart money has shown its hand twice.
Real Consistent Precision
Instead of squinting at charts trying to identify subjective "zones within zones," let mathematics do the heavy lifting.
In trading, consistency beats creativity. Stop drawing arbitrary lines and hoping for the best. Start trading with mathematical precision.
Documentation and full trading system instructions can be found on the indicator's publication → https://www.tradingview.com/script/5sSpi7wR-BullTrading-Easy-Tops-Bottoms/
Trade with confidence. Trust in mathematics. Trust in your Edge.
Telegram: t.me/+GB-FGLPyaQJjYWQz YouTube: youtube.com/@gustavorubi3740 💻 BullTradingIndicators.com Note: If you are looking for V7 use this link: bulltradingindicators.com/registration
Disclaimer
The information and publications are not meant to be, and do not constitute, financial, investment, trading, or other types of advice or recommendations supplied or endorsed by TradingView. Read more in the Terms of Use.