Main chart looks little bit messy, let`s take a look at one by one.
before going on, I am not used to harmonic pattern, so if there is any mistake, plz blame me hard at the comment :D

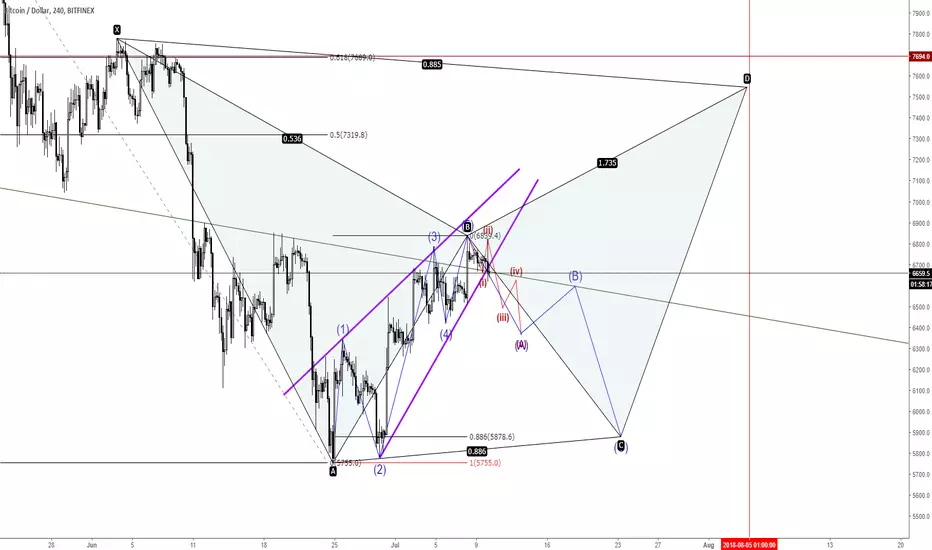
It broke down the wedge(purple) and struggles at neckline.
However, the most important thing is these two candles

Because of these candles, it is now really difficult to count EW in red zone.

I think it should go up $6,839 but it get finally rejected at (ii) in this picture, and break down to $6,643 below
Answer this question : "It could go up higher easily(such as $7,000~$7,150), why whales forced to fail EW in here??, it was UNNATURAL?"
The answer is "They don`t want you to see $7,000"

If some miracle happens, we might go up to $7K.
But as I told you above, it is really difficult to count EW in the red zone.
So, I think it will not likely to happen
Anyway bears win, my current counting is below:

Of course wave (C) can end between $6,300~$6,100, but I just studied gartley and wanted to apply it :D
Final prediction (based on my 4th of July analysis)

before going on, I am not used to harmonic pattern, so if there is any mistake, plz blame me hard at the comment :D
It broke down the wedge(purple) and struggles at neckline.
However, the most important thing is these two candles
Because of these candles, it is now really difficult to count EW in red zone.
I think it should go up $6,839 but it get finally rejected at (ii) in this picture, and break down to $6,643 below
Answer this question : "It could go up higher easily(such as $7,000~$7,150), why whales forced to fail EW in here??, it was UNNATURAL?"
The answer is "They don`t want you to see $7,000"
If some miracle happens, we might go up to $7K.
But as I told you above, it is really difficult to count EW in the red zone.
So, I think it will not likely to happen
Anyway bears win, my current counting is below:
Of course wave (C) can end between $6,300~$6,100, but I just studied gartley and wanted to apply it :D
Final prediction (based on my 4th of July analysis)
Note
Bears might think "we must make it down below ema 200 in 4hr chart"
If it break up ema 200 in 4hr chart next time, It can be signal of reversal.
Note
If we break down to final deadline, it confirms that we are going down
Note
The only way we can see $7,000!!
ending diagonal
if $6,616 is end of wave 4, it could go up till $7,030
Note
it managed to defense final deadline lol
let`s see what happen next
Note
current recommended positionDisclaimer
The information and publications are not meant to be, and do not constitute, financial, investment, trading, or other types of advice or recommendations supplied or endorsed by TradingView. Read more in the Terms of Use.
Disclaimer
The information and publications are not meant to be, and do not constitute, financial, investment, trading, or other types of advice or recommendations supplied or endorsed by TradingView. Read more in the Terms of Use.