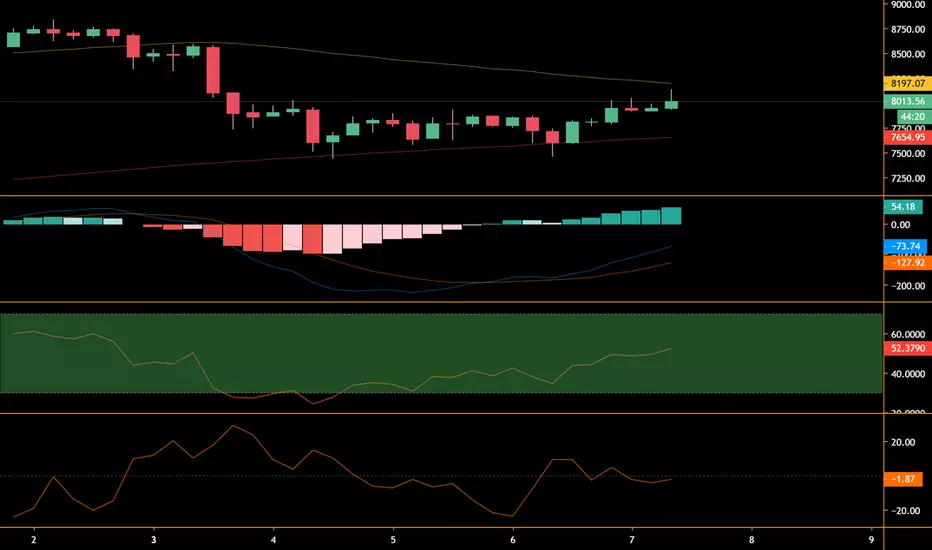
BTC appears to be trading within the 50/200 SMA on the 4 hr chart, with the 200 SMA acting as support and the 50 SMA acting as major overhead resistance. BTC may retest this resistance (around 8,190) soon. If it fails to convincingly break out, there could be another large drop.
Disclaimer
The information and publications are not meant to be, and do not constitute, financial, investment, trading, or other types of advice or recommendations supplied or endorsed by TradingView. Read more in the Terms of Use.
Disclaimer
The information and publications are not meant to be, and do not constitute, financial, investment, trading, or other types of advice or recommendations supplied or endorsed by TradingView. Read more in the Terms of Use.