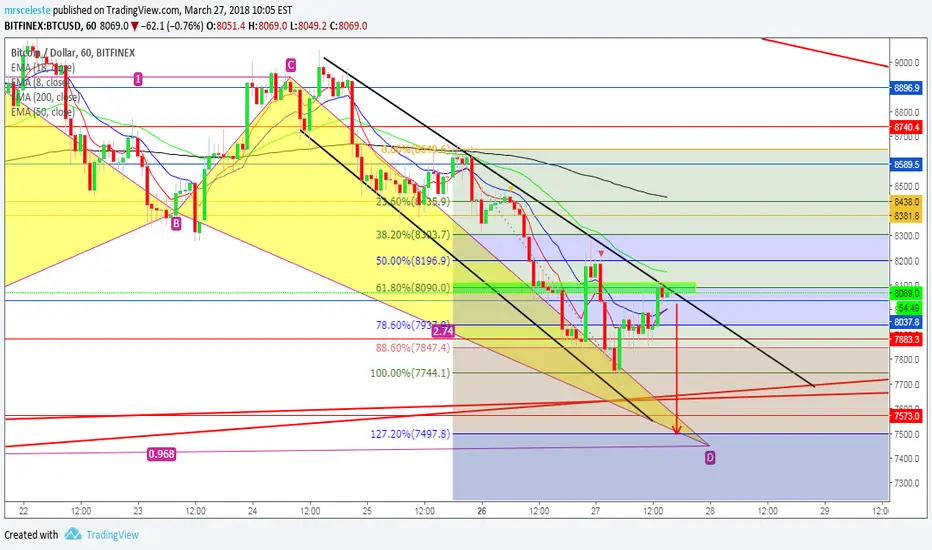
BTC USD is still getting heavy pressure from the bears. There is forming a nice gartley pattern. It appears the right side is forming a nice channel. We can draw a couple of trend lines (in black) to use as a guide off which to enter a short position for a short term sell rally. Using the fibonacci tool, the last retracement hit the 61.8% level, and if this plays out right, we may be able to expect price to fall at the 127% level, back down to 7,600 to 7,500, area, which is a major area of support an the day chart. Price is falling still under the 200 EMA (in black) which points to the fact that we are still in a downtrend. gives us a good view also of the directional trend downward for the short term. From there we need to watch and see what happens beyond that. I do believe that we will hit lower levels in the 6,000 range mid-term and maybe below before the bulls rally back up.
This analysis is for demonstration and sharing purposes and is no guarantee that these events will play out. Trade at your own risk. Please offer comments or feedback as well. I am always a student.
This analysis is for demonstration and sharing purposes and is no guarantee that these events will play out. Trade at your own risk. Please offer comments or feedback as well. I am always a student.
Trade active
Trade is playing out nicely..A major support line was recently broken. You could have taken profit, or you can choose to move your stop loss to conserve profits as we continue to monitor. As always past results do not guarantee future profits.Note
Click arrows on right above to show new bars as well.Trade closed: target reached
Disclaimer
The information and publications are not meant to be, and do not constitute, financial, investment, trading, or other types of advice or recommendations supplied or endorsed by TradingView. Read more in the Terms of Use.
Disclaimer
The information and publications are not meant to be, and do not constitute, financial, investment, trading, or other types of advice or recommendations supplied or endorsed by TradingView. Read more in the Terms of Use.