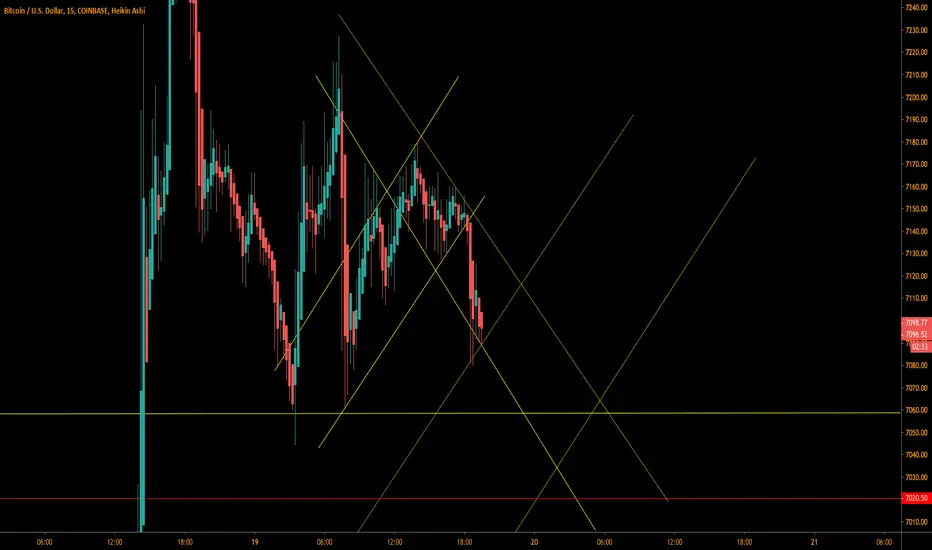
Recently posted a inverse fractal from Dec 6th, 2019 (15 Min chart). Here is where we are currently. Still looks good and hitting my trend lines! Someone please tell me how to post double charts, so I can give a better visual
Previous post info below
Previous post info below
Note
Previous post info.First post here and newbie-ish self taught trader (with the help of youtube videos and ideas posted here). I'm not here to make my charts looks fancy and all technical, I'm here to make money! Had lot's of money lost, but currently plenty of gains and couple L's when I'm trying to multitask. Words of advice, don't try to trade if your doing other stuff at the same time!!!

This is a inverse chart of December 6th that seems mirror Bitcoin's current moves, I'm not sure how to do a double view of this chart and the current one, but if you follow the current 1 min chart, it should go right along. No indicators or technical analysis , just an eye for patterns and details. I believe they have their place, but seems to add more confusion for myself.
Thinking a drop to 7040-7020 then back up to the 7200's
Disclaimer
The information and publications are not meant to be, and do not constitute, financial, investment, trading, or other types of advice or recommendations supplied or endorsed by TradingView. Read more in the Terms of Use.
Disclaimer
The information and publications are not meant to be, and do not constitute, financial, investment, trading, or other types of advice or recommendations supplied or endorsed by TradingView. Read more in the Terms of Use.