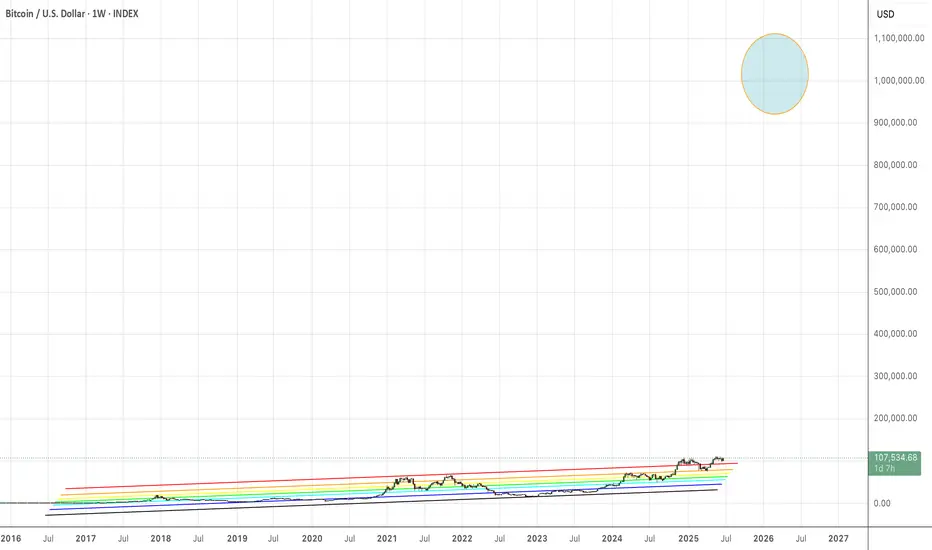
This image shows Bitcoin "all-time" bullish Fibonacci Channel, and it shows a theoretical pump up to $1M USD, based on the "stock-to-flow" model. BTC is way under the stock to flow curve. You can check it yourself. Do some research. "Diminishing-Log-Return" proponents have already been proven foolish. The "shrimp" model was always based on nothing, but old-style adherence to moving-averages and volume, and a supposed adherence to the idiot concept of diminishing log returns. Do you use log to chart in Tradingview? My guess is yes, most of the time, not all of the time, and sometimes linear and log are used together with "snap-to-rays". You use log, so you know that what happens at low price ranges also happens at high price ranges, because it's not about the price range. It's about the "amplitude" of the chart formation. Meaning, how high in % is this ascending triangle? Oh, it 800% "high". Ok, that gives me some indication that it can go 800% "higher" than the "neckline", which is the top of said ascending triangle. All seasoned technicians know this instinctively, and yet we have technicians handling hundreds of millions of dollars, and they're putting their eggs in the diminishing log returns basket - even though it's at odds with the facts on the ground. Fools! Most technicians are fools.
Disclaimer
The information and publications are not meant to be, and do not constitute, financial, investment, trading, or other types of advice or recommendations supplied or endorsed by TradingView. Read more in the Terms of Use.
Disclaimer
The information and publications are not meant to be, and do not constitute, financial, investment, trading, or other types of advice or recommendations supplied or endorsed by TradingView. Read more in the Terms of Use.