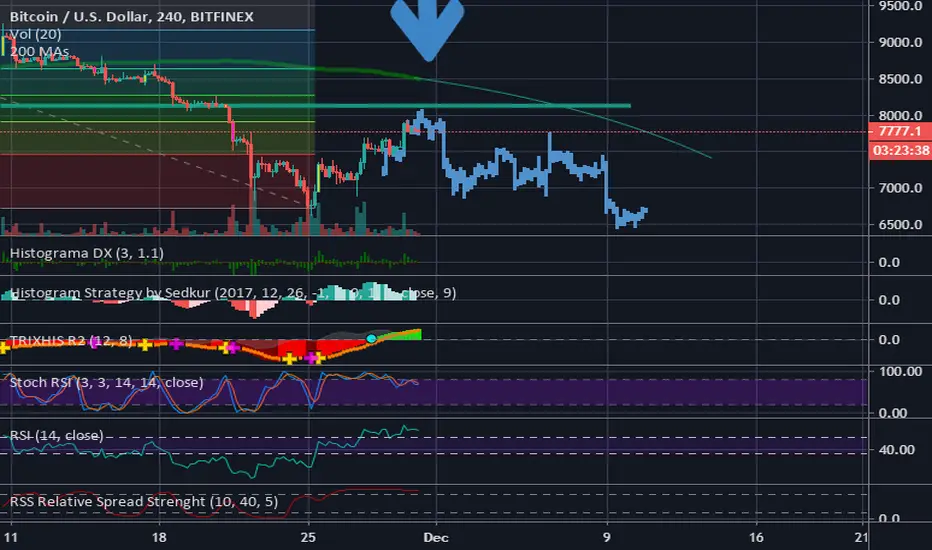
Similar behaviour with 18 Aug 2019 price action for RSI and TRIX momentum oscillator.
Similar market context - bounce after downtrend rally
Maximum peak up to:
- 8100 USD
- Similar price range of the symmetrical H&S pattern
- 0.5 FiB range
- stay below 200 EMA
Similar market context - bounce after downtrend rally
Maximum peak up to:
- 8100 USD
- Similar price range of the symmetrical H&S pattern
- 0.5 FiB range
- stay below 200 EMA
Disclaimer
The information and publications are not meant to be, and do not constitute, financial, investment, trading, or other types of advice or recommendations supplied or endorsed by TradingView. Read more in the Terms of Use.
Disclaimer
The information and publications are not meant to be, and do not constitute, financial, investment, trading, or other types of advice or recommendations supplied or endorsed by TradingView. Read more in the Terms of Use.