Description:
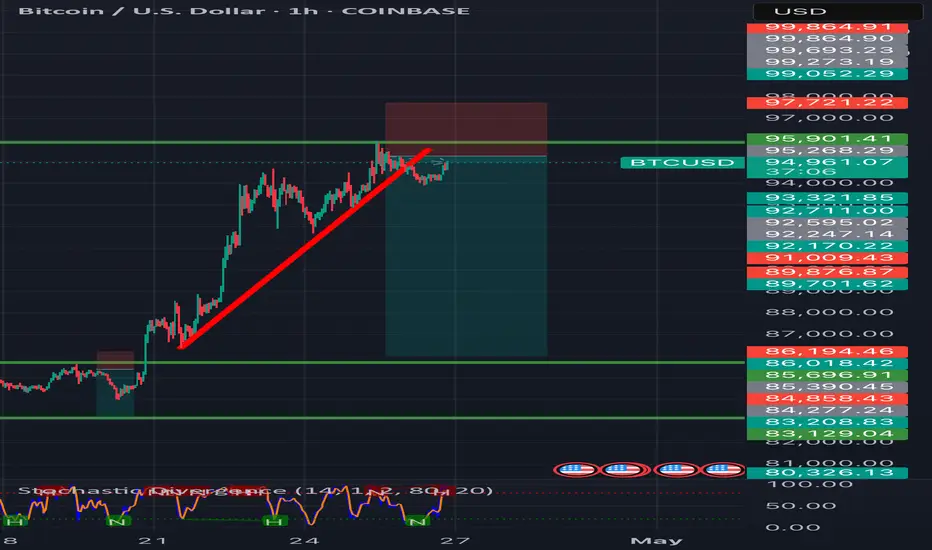
Bitcoin is rejecting major resistance near $94,000 after forming a bearish engulfing candle on the 4H chart.
• Key Resistance: $94,000–$95,000 zone rejected with strong selling pressure.
• RSI Divergence: Bearish divergence between price and RSI confirms weakness.
• Break of Support: Price broke minor support at $92,800, shifting short-term structure bearish.
• Moving Averages: Trading below the 50 EMA on the 4H chart, signaling bearish momentum.
Sell Setup:
• Look for entries around $93,500–$94,000 (retest zone).
• Stop-loss above $95,000.
• TP1: $91,000
• TP2: $88,500
Bitcoin is showing clear signs of a pullback — sellers are currently in control.
Disclaimer
The information and publications are not meant to be, and do not constitute, financial, investment, trading, or other types of advice or recommendations supplied or endorsed by TradingView. Read more in the Terms of Use.
Disclaimer
The information and publications are not meant to be, and do not constitute, financial, investment, trading, or other types of advice or recommendations supplied or endorsed by TradingView. Read more in the Terms of Use.