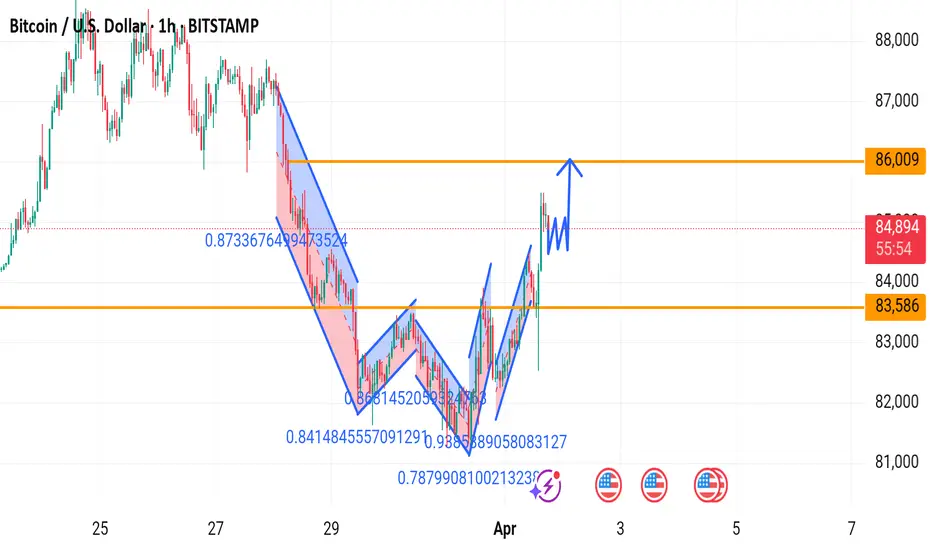
The image is a Bitcoin (BTC/USD) price chart from TradingView, shared by "Forex_Trading_Team" on April 1, 2025, at 18:02 UTC. The chart shows the 1-hour timeframe for Bitcoin on the BITSTAMP exchange.
Key Observations:
Current Price: $84,889 (+2.85%)
Support & Resistance:
Support near $83,586
Resistance around $86,009
Chart Pattern:
The chart includes harmonic patterns (possibly a bullish bat or Gartley) with Fibonacci retracement levels.
A bullish breakout appears to be in progress, indicated by an upward arrow prediction.
A potential consolidation phase is marked before another move upward.
This suggests that traders are expecting Bitcoin to test the resistance at $86,009 after stabilizing around the $84,000 level. Would you like a deeper technical analysis?
Trade closed: target reached
BTCUSDT Target successfully reached. XAUUSD GOLD + BTCUSD Daily 6-7 Free Signals📊🚀
💫Best Trading Team
✅GOLD
✅BTC
✅EURUSD
✅USDJPY
TELEGRAM CHANNEL 👇🏻👇🏻👇🏻👇🏻👇🏻👇🏻
t.me/Gold_Derive_Killer01
💫Best Trading Team
✅GOLD
✅BTC
✅EURUSD
✅USDJPY
TELEGRAM CHANNEL 👇🏻👇🏻👇🏻👇🏻👇🏻👇🏻
t.me/Gold_Derive_Killer01
Disclaimer
The information and publications are not meant to be, and do not constitute, financial, investment, trading, or other types of advice or recommendations supplied or endorsed by TradingView. Read more in the Terms of Use.
XAUUSD GOLD + BTCUSD Daily 6-7 Free Signals📊🚀
💫Best Trading Team
✅GOLD
✅BTC
✅EURUSD
✅USDJPY
TELEGRAM CHANNEL 👇🏻👇🏻👇🏻👇🏻👇🏻👇🏻
t.me/Gold_Derive_Killer01
💫Best Trading Team
✅GOLD
✅BTC
✅EURUSD
✅USDJPY
TELEGRAM CHANNEL 👇🏻👇🏻👇🏻👇🏻👇🏻👇🏻
t.me/Gold_Derive_Killer01
Disclaimer
The information and publications are not meant to be, and do not constitute, financial, investment, trading, or other types of advice or recommendations supplied or endorsed by TradingView. Read more in the Terms of Use.