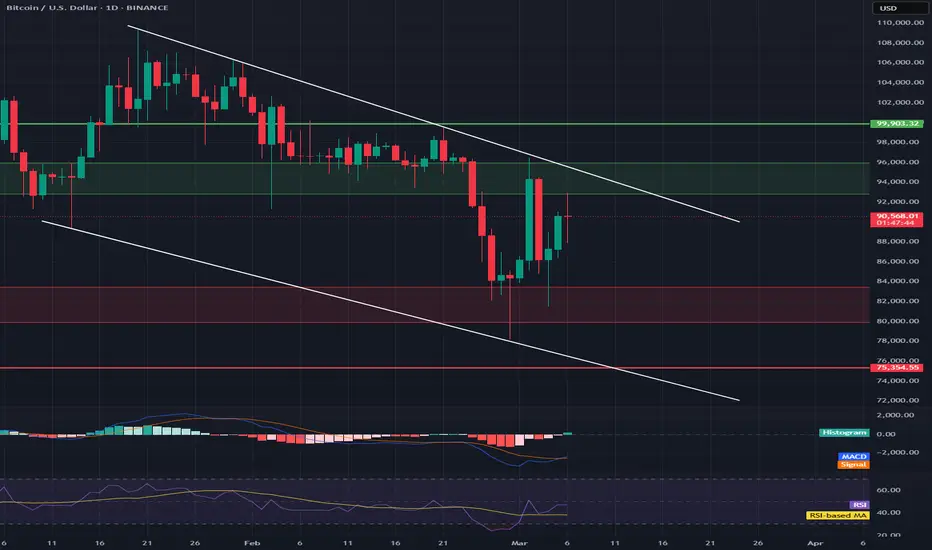
Hello everyone, I invite you to review the current situation on BTC. When we enter the one-day interval, we can see how the BTC price is moving in the formed downtrend channel in which we are again approaching its upper limit.
Here you can see how the current rebound has approached the resistance zone from $ 92,851 to $ 95,975, which the price cannot break through, only when we exit it upwards will the path open towards resistance at $ 99,903.
Looking the other way, we can see that in the first place we have a significant support zone from $ 93,477 to $ 79,907, which currently manages to keep the price from larger declines. However, when the zone is broken, we can see the price going down to the level of $ 75,354.
On the MACD indicator we can observe a fight to return to the upward trend in which we have a lot of room for price increases, while on the RSI indicator we are approaching the middle of the range which still gives room for growth, however, at this level we could previously see a reaction, which is something to watch out for.
Disclaimer
The information and publications are not meant to be, and do not constitute, financial, investment, trading, or other types of advice or recommendations supplied or endorsed by TradingView. Read more in the Terms of Use.
Disclaimer
The information and publications are not meant to be, and do not constitute, financial, investment, trading, or other types of advice or recommendations supplied or endorsed by TradingView. Read more in the Terms of Use.