I believe we are now near a buying opportunity for Bitcoin. Please check my previous idea also, on the link below.
Bitcoin, like other markets, has multiple relatively predictable recurring cycles that can be a guide to us to know when to buy or to sell.
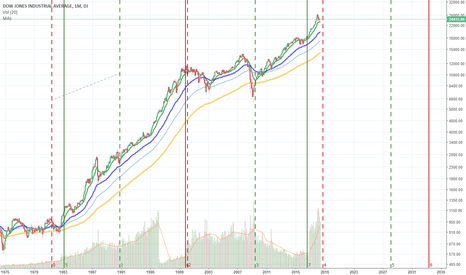
This chart shows just one of the cycles. Each half cycle is approximately 1 mo, but the time between each line is always exactly the same.
Keep in mind, that at the bottom of a cycle, there are more people advising you that the price will go DOWN. At the top of the cycle, there are more people advising you that the price will go UP. This is why we need something more objective than what people feel or think about what will happen.
Based on shorter cycles, I do not think May 31 is the best day to buy. I am personally looking at June 1-5 for better times to buy. June 1 evening (Eastern time) may be our next buying opportunity.
A study of these cycles can be a helpful guide. This cycle on the chart is not the only cycle. Soon, I will post a separate idea on the LONG-TERM cycles of Bitcoin so you can get a better feel of where BTC will head on a longer timeframe. STAY Tuned! Keep my profile handy so you can keep checking my new ideas.
Please click like if you like the idea.
Please give any comments below.
Disclosure - LONG USDT, LONG USD. looking to buy crypto soon.
See my previous idea

To learn more about how market cycles work -- I have a more detailed idea here:

Bitcoin, like other markets, has multiple relatively predictable recurring cycles that can be a guide to us to know when to buy or to sell.
This chart shows just one of the cycles. Each half cycle is approximately 1 mo, but the time between each line is always exactly the same.
Keep in mind, that at the bottom of a cycle, there are more people advising you that the price will go DOWN. At the top of the cycle, there are more people advising you that the price will go UP. This is why we need something more objective than what people feel or think about what will happen.
Based on shorter cycles, I do not think May 31 is the best day to buy. I am personally looking at June 1-5 for better times to buy. June 1 evening (Eastern time) may be our next buying opportunity.
A study of these cycles can be a helpful guide. This cycle on the chart is not the only cycle. Soon, I will post a separate idea on the LONG-TERM cycles of Bitcoin so you can get a better feel of where BTC will head on a longer timeframe. STAY Tuned! Keep my profile handy so you can keep checking my new ideas.
Please click like if you like the idea.
Please give any comments below.
Disclosure - LONG USDT, LONG USD. looking to buy crypto soon.
See my previous idea

To learn more about how market cycles work -- I have a more detailed idea here:

Note
Please note something important about these cycles -- I have seen some other people posting about the 60 day cycles of BTC, and the lows and highs being on the 6 of the month.... That is true, but remember there are other cycles going on - both shorter term like a few days, and a few hours, etc And longer term cycles like an approx 4-5month cycle, and even longer term cycles. Due to the shorter term cycles varying, the actual lows and high may NOT land exactly on the 6th. And the actual effect of these 30d cycles will vary depending what the longer term trend is. If we only calculate ONE cycle, it won't really be enough information. Soon I will post a longer term view of BTC cycles. I will post the link here.Note
Here is a view at the longer term cycles of Bitcoin.Note
Update 6/10/18. The crypto market has gotten slammed. So far I don't think this really changes anything I said before. I did say multiple times, the actual bottom does not necessarily occur exactly at the transition lines of the cycle. The market could even go down from here over the next 2-3 days, possibly. We will see. Note that the previous bottom before this was May 29. If the bottom does not occur on the exact date of the cycle, then it means we usually have some type of double bottom pattern, though one of the double bottoms can be higher than the other. We need this kind of selling day to let the buyers step in. So, I still think we can see this as a buying opportunity. If it goes a bit lower, then an even better buying opportunity. Look for better selling times between August - October.Note
Update 6/12/18. I suspect most likely that the bottom will be anywhere between today and 6/15/18. It's hard for me to tell exactly what day based on the shorter cycles. It could go a bit lower, or maybe not. Either way, I think its a chance to buy now.Related publications
Disclaimer
The information and publications are not meant to be, and do not constitute, financial, investment, trading, or other types of advice or recommendations supplied or endorsed by TradingView. Read more in the Terms of Use.
Related publications
Disclaimer
The information and publications are not meant to be, and do not constitute, financial, investment, trading, or other types of advice or recommendations supplied or endorsed by TradingView. Read more in the Terms of Use.


