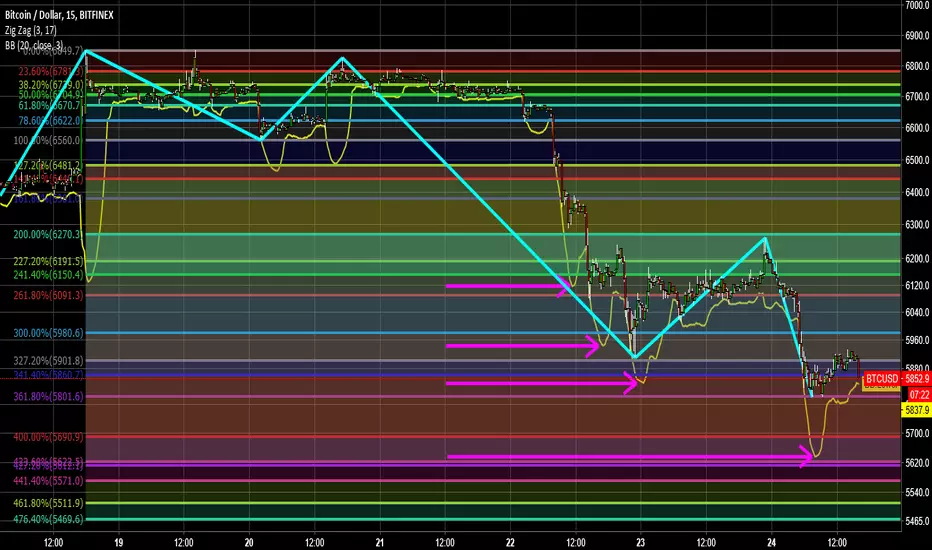
Using Zig Zag for wave count, Fibonacci extensions from 1st Wave, and a Lower Bollinger line set at 20, close, 3.
Note
It's a 15min chart so nice updates.Note
Interesting market has recently shot up again, guess didn't think worth waiting to hit the extra $130 odd. My next chart will probably be the 2 hour chart again to show why market shot up using the Ultimate Oscillator, and the Volume Oscillator. Need to see where market ends on the hour which is in less than 15 minutes away.Disclaimer
The information and publications are not meant to be, and do not constitute, financial, investment, trading, or other types of advice or recommendations supplied or endorsed by TradingView. Read more in the Terms of Use.
Disclaimer
The information and publications are not meant to be, and do not constitute, financial, investment, trading, or other types of advice or recommendations supplied or endorsed by TradingView. Read more in the Terms of Use.
