MACD just completed a recognisable pattern
Note
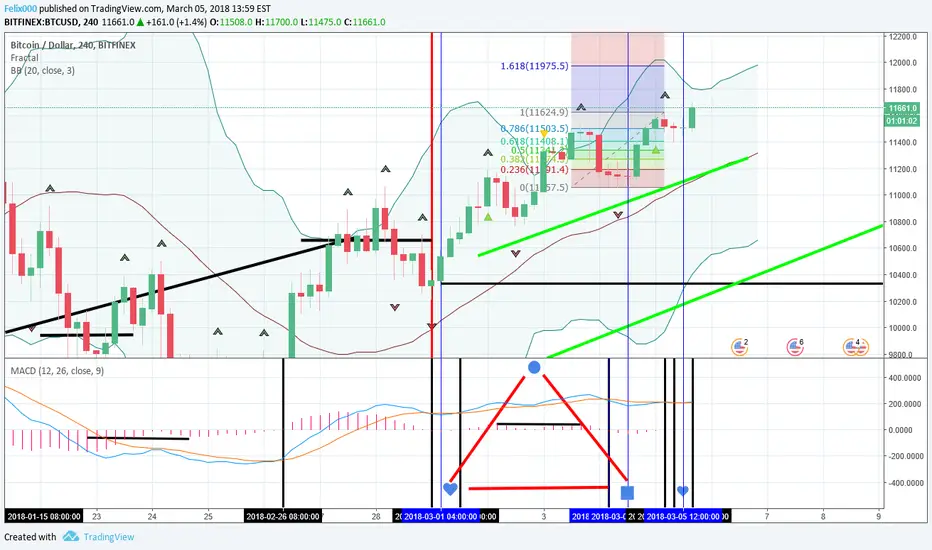
4 Hour ChartNote
I've been studying the Stoch RSI( 3,3,14,14,Close) on the 4 hour chart and of the key points which I've been tracking in the MACD (marked with Hearts and Squares) only on two occasions have these key points started their runs from the centre of the Stoch RSI they were 24th Dec 2017 $11,600 to $16,494 and 13th Feb 2018 $8,458 to $11,250 and then on to $11,780. The challenge may be harder this time Y/N ?Note
The stop loss at $11,432 on the 4 hour chart turned out to be a good idea. The next key bar is the MACD trough that I marked with a square it has a high of $11,239 and low of $11,076. If it breaches $11,076 then market could repeat the pattern that happened 14th January when the market went up and then down. There is always a chance the MACD may complete another recognisable pattern instead of heading down. Most of my work covers only February so far and in not much detail going back to December. I have not seen the 4 hour chart behaving like this before which does not help in trying to pick winners.Note
CHECK OUT MY LATEST PUBLISHED IDEA - Bitcoin bear next 28hrs here's why Y/NI have analysed the 4 hour Stoch RSI and MACD. My last idea was great, but Stoch RSI shape was a "W" not "M" hence market went down. I did not spot it. I have subsequently made an interesting pattern discovery with timing potential. I have marked areas in grey. In the first two grey areas the MACD bars had been making peaks and the market going up. This time the market is making troughs so the maerket if it repeats pattern should be going down further till at least 1 hour before Wall Street closes tommorow. Whether it continues down or reverses after that I do not know. A stop between 11039 and 11311 may be worth a punt going short (how I creat the red horizontals in the Stoch RSI and how I create the hearts and squares in the MACD I've mentioned in previous postings. I may publish twice to show better current detail.
Note
Thanks for the thumbs up guys but why isn't anybody giving me thumbs up for the idea with the chart published Mar 6 2018 16:10 and close up version Mar 6 2018 16:14 they look really nice and I put a lot of effort in ???Note
Comment: Just an update on my most recent published idea. Signal on 2 hour but sticking to short - Here's why. Interesting signals on 2 hour chart. Would normally have me thinking to buy, however, although the lowest trough in the bars of MACD remained the lowest trough before crossover the corresponding candlestick above which made a low of $9,047 was later beaten by a candlestick bar with a lower low of $9,045 before the MACD crossover. Therefore I'm not buying into this signal and still thinking of another short leg down coming up. Bollinger bars $9,442 and $8,838 could now need a break by a candle stick for any move up or down.
Note
When talking about lower low in last comment I'm just talking about opening price and closing price not the highs and lowsNote
Most recently on the 2 hour chart. Bollinger tip working out well. Last time Bollinger Bands were this narrow breaks were significant. Check out: 1 Feb Down; 13 Feb Up; 26 Feb Up; 6 Mar Down. The blue and black arrow pattern Stoch RSI also good but had to wait for the net top. After that like last time the market is finally heading south. When talking about the Bollinger Bands I meant the 2 hour chart, and of course my Bollinger Bands are not the default but my own setting (20, close, 3)Note
If anybody wants to check my latest postings or all my postings just click on the "F" symbol with purple background.Disclaimer
The information and publications are not meant to be, and do not constitute, financial, investment, trading, or other types of advice or recommendations supplied or endorsed by TradingView. Read more in the Terms of Use.
Disclaimer
The information and publications are not meant to be, and do not constitute, financial, investment, trading, or other types of advice or recommendations supplied or endorsed by TradingView. Read more in the Terms of Use.