
Side by side fractal top formation comparison BTCUSD on the left on a 6 hour chart compared to XRPUSD on the right side on a 12 minute chart. Although the time scale is massively different the movements seem quite similar and if you move each chart to the left you will see even more correlation. It's interesting and potentially useful for a prediction? We'll see I guess.
If this move happens, and using BTCUSD chart could predict the next move in XRPUSD, then the XRPUSD chart could provide an outlook on where potentially BTCUSD might move as the Ripple chart is moving much much quicker. I'm curious to see how this idea plays out.
If this move happens, and using BTCUSD chart could predict the next move in XRPUSD, then the XRPUSD chart could provide an outlook on where potentially BTCUSD might move as the Ripple chart is moving much much quicker. I'm curious to see how this idea plays out.
Note
Target met, so far so good... very interesting...
Note
Second target has also been met on the Ripple chart and it`s kind of creepy how the price movement is overlapping my green drawing almost exactly...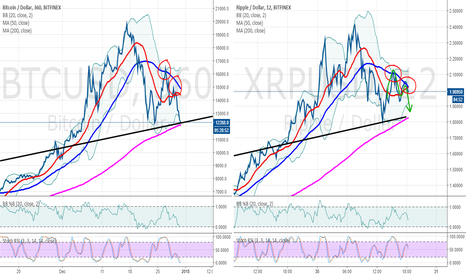
Note
And down she goes after a little hang up on the double top there and has met target three. So now what?... Will Ripple make a move that will be repeated by BTCUSD? We will see... but this time to verify the idea it will take much longer so I will post a chart in a few days maybe longer?
Note
I just wanted to provide a quick update to this experimental idea and it was great news that Ripple had a breakout move. I entered long at 1.80 and so I did miss the low but looking now at the chart it was foolish of me to miss it because of the trending lower lows in the consolidation. Bitcoin 4.98% could follow a similar path however it has steadfastly stuck to it's support lever around 12000 so far. I can only plot two potential pathways for now as there is not yet a clear indication that this support will be broken. If it does fail we could see BTCUSD 4.98% fall to the 8500 range or potentially lower.
As you can see the 50 MA is creeping down on the 200 MA and this will not have a good result when it crosses, so we will watch this move carefully and possibly one strategy would be to exit on an uptick and wait the move out.
Happy New Year everyone! And happy trading, wishing you the most successful trades for this coming year!

Disclaimer
The information and publications are not meant to be, and do not constitute, financial, investment, trading, or other types of advice or recommendations supplied or endorsed by TradingView. Read more in the Terms of Use.
Disclaimer
The information and publications are not meant to be, and do not constitute, financial, investment, trading, or other types of advice or recommendations supplied or endorsed by TradingView. Read more in the Terms of Use.