Market Context
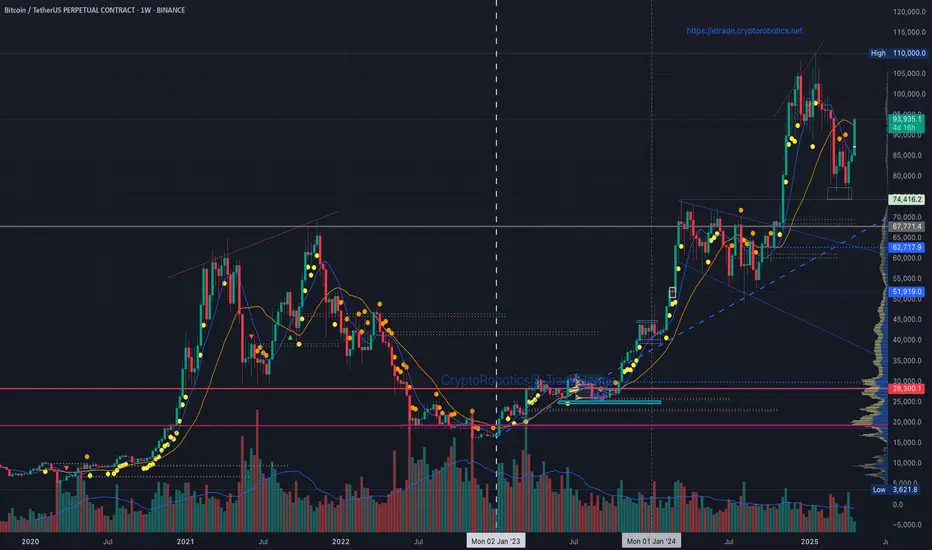
Bitcoin has demonstrated renewed strength, breaking out from the recent consolidation phase and moving firmly back above the $90,000 level. This move follows a successful defense of the $74,000–76,000 range, which now acts as a strong weekly demand zone.
The current weekly candle (as of midweek) is developing into a bullish engulfing pattern with solid volume support, indicating momentum may be building for further continuation.
Key Technical Zones:
📌 Support Levels:
• $74,400 – $76,000 → Previous swing low + liquidity zone.
• $65,000 → Confluence with trendline support & prior consolidation.
• $51,900 – $52,000 → Strong historical support on VPVR.
📌 Resistance Levels:
• $95,000 – $98,000 → Local resistance and prior range midline.
• $105,000 – $110,000 → Weekly highs and Fibonacci extension zone.
• Above $110,000 → Potential discovery zone with limited historical structure.
🧭 Trend & Structure:
The broader trend remains bullish on the weekly timeframe. After a healthy correction from the $110,000 high, BTC has printed a higher low, suggesting the continuation of the longer-term uptrend remains intact.
The chart also highlights the breakout from the symmetrical triangle formation that began in Q1 2024 — this breakout is being respected and validated.
https://www.tradingview.com/x/bf2yMxRk/
Disclaimer
The information and publications are not meant to be, and do not constitute, financial, investment, trading, or other types of advice or recommendations supplied or endorsed by TradingView. Read more in the Terms of Use.
Disclaimer
The information and publications are not meant to be, and do not constitute, financial, investment, trading, or other types of advice or recommendations supplied or endorsed by TradingView. Read more in the Terms of Use.