Supertrend – Multi-Timeframe Support & Resistance
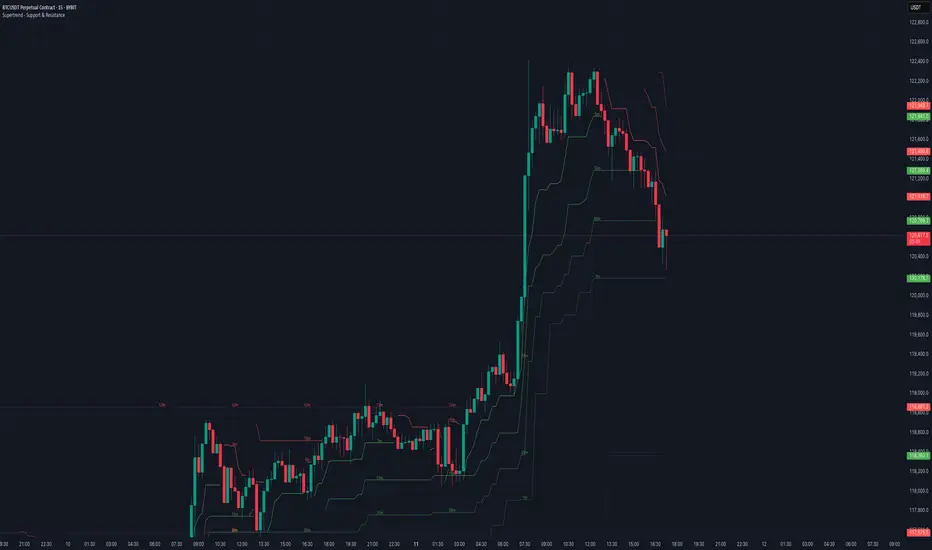
This script overlays multiple Supertrend bands from higher timeframes on a single chart and treats them as dynamic support and resistance. The goal is simple: see the bigger picture without leaving your current timeframe.
What it does
• Calculates Supertrend using the same ATR Length and Factor across 5m, 15m, 30m, 1h, 4h, 8h, 12h, and 1D.
• Pulls each timeframe via request.security(..., lookahead_off) so values only update on candle close. No look-ahead, no “teleporting” lines.
• Plots each timeframe’s Supertrend as an on-chart band with increasing transparency the higher you go, so you can visually separate short-term vs higher-timeframe structure.
• Colors indicate direction:
• Green = bearish band above price (acting as resistance)
• Red = bullish band below price (acting as support)
• Drops compact labels (5m, 15m, 30m, etc.) every 20 bars right on the corresponding Supertrend level, so you can quickly identify which line belongs to which timeframe.
Why this helps
Supertrend is great for trend definition and trailing stops. But one timeframe alone can whipsaw you. By stacking multiple timeframes:
• Confluence stands out. When several higher-TF bands cluster, price often reacts.
• You see where intraday pullbacks are likely to pause (lower TF bands) and where trend reversals are more meaningful (higher TF bands).
• It’s easier to align entries with the dominant trend while still timing them on your working timeframe.
How it works (quick refresher)
Supertrend uses ATR to offset a median price with a multiplier (Factor). When price crosses the band, direction flips and the trailing line switches sides. This script exposes:
• ATR Length (default 10): sensitivity of the ATR. Smaller = tighter band, more flips. Larger = smoother, fewer flips.
• Factor (default 3.0): multiplier applied to ATR. Larger = wider band, more conservative.
The same settings are used for all timeframes for clean, apples-to-apples comparisons.
How to use it
• Trend alignment: Prefer longs when most higher-TF lines are below price (red support). Prefer shorts when most are above price (green resistance).
• Pullback entries: In an uptrend, look for pullbacks into a lower-TF red band that lines up near a higher-TF red band. That overlap is your “zone.”
• Breakout confirmation: A strong break and close beyond a higher-TF band carries more weight than a lower-TF poke.
• Stops and targets: Use the nearest opposing band as a logic point. For example, in a long, if price loses the lower-TF red band and the next higher-TF band is close overhead, trim or tighten.
Signals you can read at a glance
• Stacking: Multiple red bands beneath price = strong bullish structure. Multiple green bands above price = strong bearish structure.
• Compression: Bands from different TFs squeezing together often precede expansion.
• Flip zones: When a higher-TF band flips side, treat that level as newly minted support/resistance.
Design choices in the code
• lookahead_off on all request.security calls avoids repainting from future data.
• Increasing transparency as the timeframe rises makes lower-TF context visible without drowning the chart.
• Labels every 20 bars keep the chart readable while still giving you frequent anchors.
Good to know (limits and tips)
• This is an overlay of closed-bar Supertrend values from higher TFs. Intrabar moves can still exceed a band before close; final signal prints at candle close of that timeframe.
• Using the same ATR/factor across TFs makes confluence easier to judge. If you need independent tuning per TF, you can clone the security calls and add separate inputs.
• On very low timeframes with many symbols, multiple request.security calls can be heavy. If performance drops, hide one or two higher TFs or increase the label spacing.
Risk note
This is a context tool, not an auto-trader. Combine it with structure (HH/HL vs LH/LL), volume, and your execution rules. Always test on your market and timeframe before committing real capital.
Disclaimer
The information and publications are not meant to be, and do not constitute, financial, investment, trading, or other types of advice or recommendations supplied or endorsed by TradingView. Read more in the Terms of Use.
Disclaimer
The information and publications are not meant to be, and do not constitute, financial, investment, trading, or other types of advice or recommendations supplied or endorsed by TradingView. Read more in the Terms of Use.