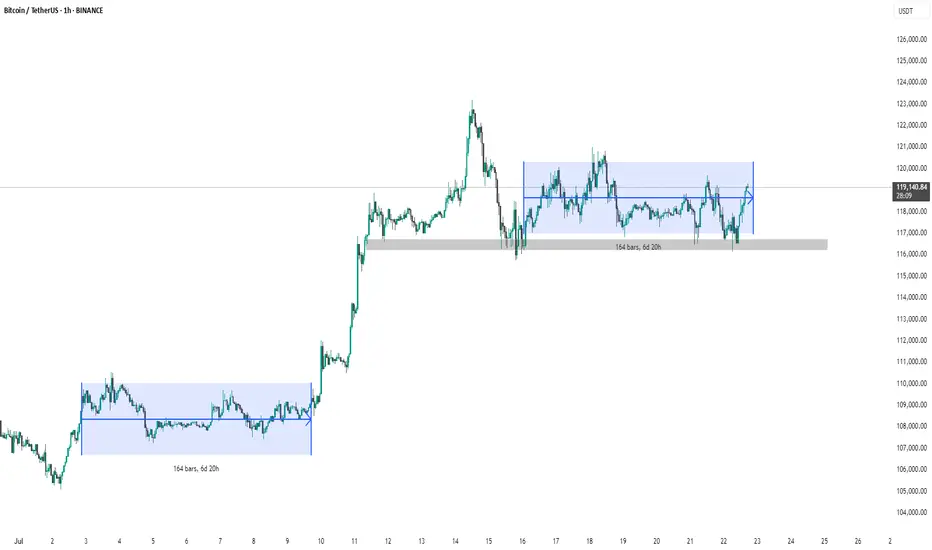
This Bitcoin (BTC/USDT) 1-hour chart shows two clear consolidation phases marked by blue rectangles. Each consolidation lasted 164 bars (~6 days 20 hours). After the first range, Bitcoin broke out upwards, leading to a strong rally. The current price action is again testing the upper boundary of the second consolidation range ($119,200), indicating a possible breakout. The gray zone ($116,500) highlights a key support level. A breakout above the range could signal another bullish continuation.
thanking you
thanking you
Related publications
Disclaimer
The information and publications are not meant to be, and do not constitute, financial, investment, trading, or other types of advice or recommendations supplied or endorsed by TradingView. Read more in the Terms of Use.
Related publications
Disclaimer
The information and publications are not meant to be, and do not constitute, financial, investment, trading, or other types of advice or recommendations supplied or endorsed by TradingView. Read more in the Terms of Use.