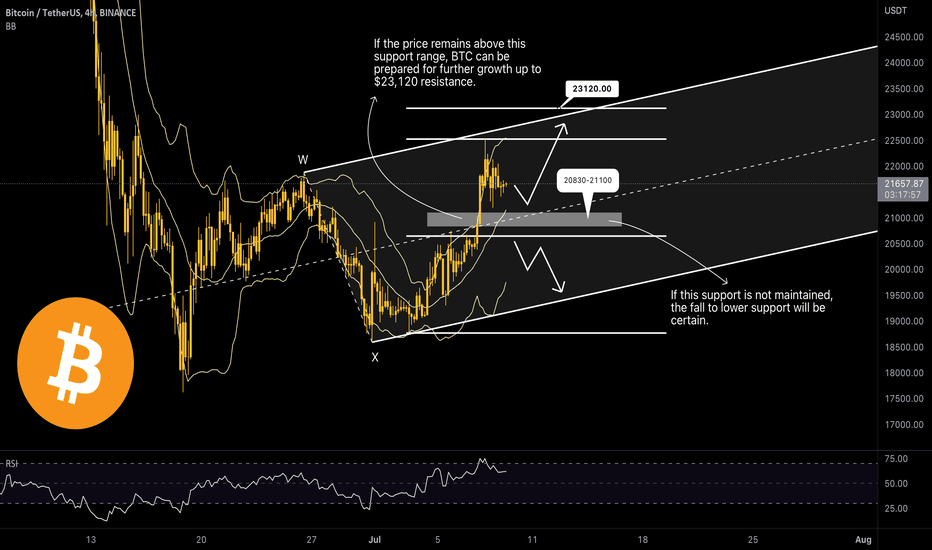
Hello to all members of TradingView and my followers.
On the daily time frame, as you can see, there is a downtrend line with high resistance that Bitcoin has yet to break.
If you look closely at the RSI, you will see that we also have a hidden divergence.
For this divergence to fail, the downward trend line must break and move up and be able to touch the place where the previous peak was located (the range of $22,000-21,900).
Otherwise, the divergence will work, and we will see the lower supports, which are $19,000 and $18,000. In the range of $18,900, we have the bottom of the triangle pattern for support.
If the price falls, the bottom of the triangle pattern can partially stop the fall.
So for us now, more negative than positive signals have been issued.
If it is helpful to you, please like it. If you have a comment, I'll be happy to know. Respectfully.
Trade active
On the daily time frame, Bitcoin has a very strong pattern that we can't expect more upside until the ceiling of the pattern is broken.
If it manages to break it, his first target will be the $21,600 range.
If the bottom of the triangle pattern and the $19,000 range cannot be maintained, Bitcoin will move towards lower supports. That is the range of $18,000 and $17,800.
These ranges have managed to stop the price decrease in the last week.
We can consider the range of $17,800 to $16,000 as the last strongholds of Bitcoin. Especially the range of $16,000 because the trading node ends there, and after that, we will have the range of $14,000.
Trade active
Yesterday we also saw a relatively strong increase in the dollar index and a decrease in the price of an ounce of gold.As long as the dollar index and the inflation rate in the United States are increasing, in our opinion, it is not advisable to expect strong upward movements in the crypto market.
Join our channel:
🔵 t.me/monocoin_public
🟠 t.me/monocoin_public
🔵 t.me/monocoin_public
🟠 t.me/monocoin_public
🔵 t.me/monocoin_public
🟠 t.me/monocoin_public
🔵 t.me/monocoin_public
🟠 t.me/monocoin_public
Related publications
Disclaimer
The information and publications are not meant to be, and do not constitute, financial, investment, trading, or other types of advice or recommendations supplied or endorsed by TradingView. Read more in the Terms of Use.

