Hello, traders.
If you "Follow", you can always get new information quickly.
Have a nice day today.
-------------------------------------
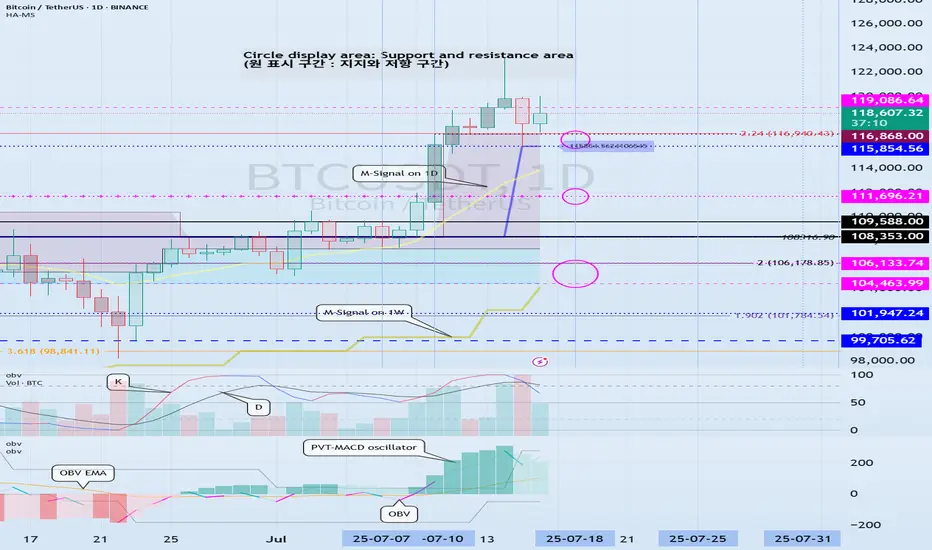
(BTCUSDT 1D chart)
On the 1W chart, the DOM(60) indicator was created at the 119086.64 point.
Accordingly, the key is whether it can be supported near 119086.64.
The meaning of the DOM(60) indicator is to show the end of the high point.
In other words, if it rises above HA-High ~ DOM(60), it means that there is a high possibility of a stepwise upward trend.
On the other hand, if it fails to rise above DOM(60), it is likely to turn into a downtrend.
The basic chart for chart analysis is the 1D chart.
Therefore, if possible, check the trend of the 1D chart first.
The DOM(60) indicator of the 1D chart is currently formed at the 111696.21 point.
And, the HA-High indicator was created at the 115854.56 point.
Therefore, since it cannot be said that the DOM(60) indicator of the 1D chart has been created yet, if the price is maintained near the HA-High indicator, it seems likely to rise until the DOM(60) indicator is created.
We need to look at whether the DOM(60) indicator will be created while moving sideways at the current price position or if the DOM(60) indicator will be created when the price rises.
If the price falls and falls below 111696.21, and the HA-High indicator is generated, the HA-High ~ DOM(60) section is formed, so whether there is support in that section is the key.
-
Since the DOM(60) indicator on the 1W chart was generated, if it fails to rise above the DOM(60) indicator, it is highly likely that the HA-High indicator will be newly generated as it eventually falls.
Therefore, you should also look at where the HA-High indicator on the 1W chart is generated when the price falls.
-
The next volatility period is around July 18 (July 17-19).
Therefore, you should look at which direction it deviates from the 115854.56-119086.64 section after this volatility period.
Since the K of the StochRSI indicator fell from the overbought section and changed to a state where K < D, it seems likely that the rise will be limited.
However, since the PVT-MACD oscillator indicator is above 0 and the OBV indicator is OBV > OBV EMA, it is expected that the support around 115845.56 will be important.
-
Thank you for reading to the end.
I hope you have a successful trade.
--------------------------------------------------
- Here is an explanation of the big picture.
(3-year bull market, 1-year bear market pattern)

I will explain the details again when the bear market starts.
------------------------------------------------------
Trade active
I think that in order for an altcoin bull market to be visible, BTC dominance must be maintained below 55.01 or continue to decline.
Accordingly, the key is whether the 55.01-62.47 range can be broken downward.
If USDT dominance is maintained below 4.91 or continues to decline, the coin market is likely to show an upward trend.
It is expected that USDT dominance will fall to around 2.84 and then rise to close the bull market.
Therefore, I think that the bull market in 2025 is likely to end.
To summarize the above, as BTC dominance falls, the price movement of BTC is likely to show a sideways pattern, and the possibility of an altcoin bull market starting is increasing.
Therefore, I think it is better to gradually increase the investment ratio towards altcoins.
As I keep saying, the expected target points of coins (tokens) that have renewed the ATH are not important.
The important thing is how to realize profits and secure profits.
In order to do so, you must have a trading strategy that fits your investment style.
To do this, we use the basic trading strategy of buying when it rises in the DOM(-60) ~ HA-Low range and selling when it falls in the HA-High ~ DOM(60) range.
In this way, you cannot sell at the highest point, but you can sell when it falls from the high point.
Also, you cannot buy at the lowest point, but you can buy when it rises from the low point.
Since the signal appears before the DOM(60) or DOM(-60) indicator is generated, you should focus on it and think about a response plan when the signal appears.
If you look at the BTCUSDT chart, you can see that it is not yet at the high point because the signal has not yet appeared.
Therefore, if the price is maintained above the HA-High indicator, that is, above 115854.56, it can be interpreted that there is still a high possibility of an increase.
This volatility period is expected to continue until July 19.
Therefore, you should check whether the price is maintained above 115854.56 after the volatility period and whether the DOM(60) indicator is about to be generated.
Currently, the DOM(60) indicator on the 1W chart was generated at the 119086.64 point.
In order for this point to serve as a support and resistance point, it must continue for at least 2 candles in the future.
That is, the DOM(60) indicator should be generated at the 119086.64 point for the next 2 weeks or more.
In that sense, we can see that the volatility period around August 2-5 is an important volatility period.
Before that, we have to go through the volatility period around July 25 and July 32, so the 115854.56 point can be seen as the most important support and resistance point at present.
Note
#BTCUSDTThis volatility period is expected to last until July 19.
And the next volatility period is expected to start around July 25.
The DOM(60) indicator on the 1W chart was created at the 119177.56 point, and the DOM(60) indicator on the 1D chart was created at the 119086.64 point.
Accordingly, the key is whether it can be supported and rise around 115854.56-119086.64.
If it falls, we should check whether it falls below the M-Signal indicator on the 1D chart, as the M-Signal indicator on the 1D chart is rising around 115856.56.
The DOM(60) indicator point must be maintained for at least 3 candles to play the role of support and resistance.
Other content (coins, stocks, etc.) is frequently posted on X.
X에 다른 내용(코인, 주식 등)이 자주 게시.
◆ t.me/readCryptoChannel
[HA-MS Indicator]
bit.ly/3YxHgvN
[OBV Indicator]
bit.ly/4dcyny3
X에 다른 내용(코인, 주식 등)이 자주 게시.
◆ t.me/readCryptoChannel
[HA-MS Indicator]
bit.ly/3YxHgvN
[OBV Indicator]
bit.ly/4dcyny3
Related publications
Disclaimer
The information and publications are not meant to be, and do not constitute, financial, investment, trading, or other types of advice or recommendations supplied or endorsed by TradingView. Read more in the Terms of Use.