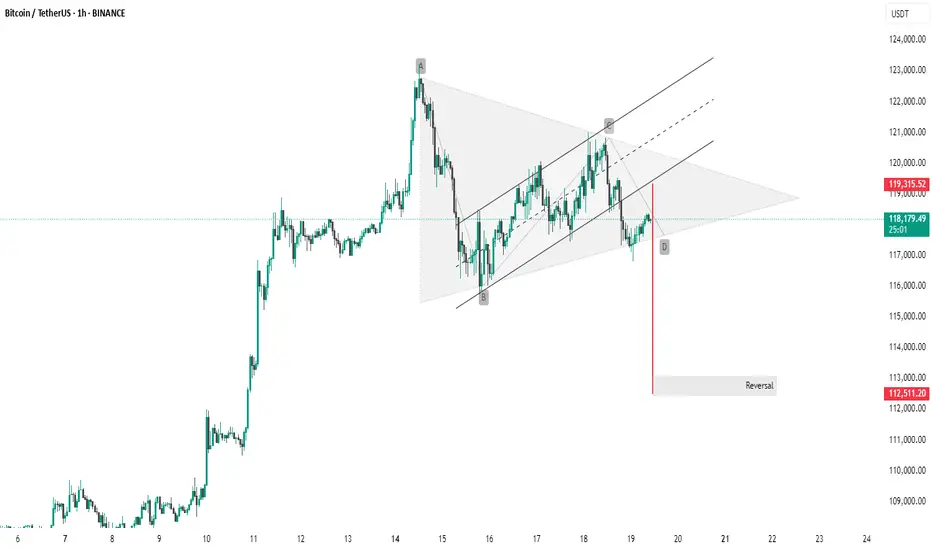
This Bitcoin (BTC/USDT) 1-hour chart shows a bearish breakout from a symmetrical triangle or rising wedge pattern. The breakout is confirmed by a strong red candle below the lower trendline, suggesting downward momentum.
Pattern: Bearish wedge/triangle.
Breakout Level: ~118,000 USDT.
Target Zone: Around 112,511 USDT, marked as a potential reversal area.
Resistance: ~119,315 USDT.
This indicates bearish sentiment in the short term unless BTC quickly reclaims the upper trendline.
Thanking you
Pattern: Bearish wedge/triangle.
Breakout Level: ~118,000 USDT.
Target Zone: Around 112,511 USDT, marked as a potential reversal area.
Resistance: ~119,315 USDT.
This indicates bearish sentiment in the short term unless BTC quickly reclaims the upper trendline.
Thanking you
Related publications
Disclaimer
The information and publications are not meant to be, and do not constitute, financial, investment, trading, or other types of advice or recommendations supplied or endorsed by TradingView. Read more in the Terms of Use.
Related publications
Disclaimer
The information and publications are not meant to be, and do not constitute, financial, investment, trading, or other types of advice or recommendations supplied or endorsed by TradingView. Read more in the Terms of Use.