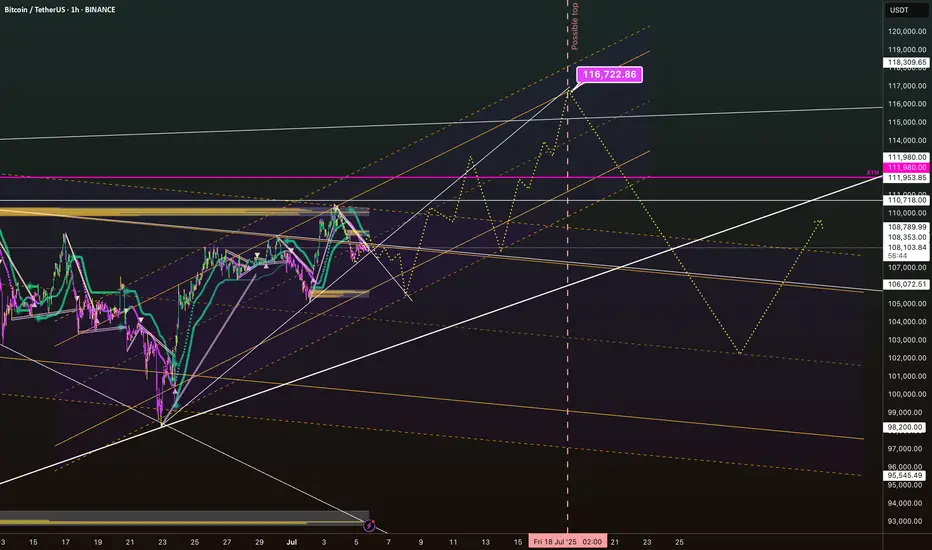
The current structure shows Bitcoin consolidating after a strong bounce off the June lows. We’re now forming a potential bullish continuation pattern within a clear rising channel (dashed yellow lines), but the price is currently testing a mid-channel liquidity zone around $108,000–$110,000.
Key observations:
Upside target: The upper channel boundary and projected fib confluence points to a bullish target of $116,722 by mid-to-late July.
Invalidations:
Sustained break below $95,000 could negate the bullish structure and push us into deeper correction territory.
Timing: The key date to watch is around July 18, where multiple structural lines and projection paths converge.
What’s your bias for July? Trap and rip… or stairway to 117K?
#Bitcoin #BTCUSDT #CryptoAnalysis #TradingView #LiquidityZones #BTCJulyOutlook
Key observations:
- Local resistance zone: $111,980 (marked ATH) – a major liquidity magnet that could trigger a squeeze if broken.
- Support range: $106,000–$103,000 – strong confluence zone if price rejects current structure.
- Potential fakeout: Liquidity dip down to the $98,200–$95,500 zone is possible before a mid-July reversal (highlighted yellow path and vertical time marker on July 18).
Upside target: The upper channel boundary and projected fib confluence points to a bullish target of $116,722 by mid-to-late July.
Invalidations:
Sustained break below $95,000 could negate the bullish structure and push us into deeper correction territory.
Timing: The key date to watch is around July 18, where multiple structural lines and projection paths converge.
What’s your bias for July? Trap and rip… or stairway to 117K?
#Bitcoin #BTCUSDT #CryptoAnalysis #TradingView #LiquidityZones #BTCJulyOutlook
Disclaimer
The information and publications are not meant to be, and do not constitute, financial, investment, trading, or other types of advice or recommendations supplied or endorsed by TradingView. Read more in the Terms of Use.
Disclaimer
The information and publications are not meant to be, and do not constitute, financial, investment, trading, or other types of advice or recommendations supplied or endorsed by TradingView. Read more in the Terms of Use.