Daily (1D) Chart Analysis
Trend Overview: BTC has been in a downtrend since its recent peak above $100K, trading below the 100 EMA (yellow) and 200 EMA (white).
Support Zones: The key support zone is around $75,000 - $77,000, where buyers could step in.
Resistance Zones: The major resistance sits near $91,000 - $95,000.
Momentum Indicators:
RSI: Around 40, showing a lack of bullish momentum.
MACD: Bearish crossover, suggesting more downside pressure.
Conclusion: BTC remains under bearish pressure unless it reclaims the 100 EMA. Watch for a possible liquidity sweep below $75K before a bullish reversal.
4H (4-Hour) Chart Analysis
Structure: BTC has been trending below the 200 EMA, confirming a bearish bias.
Resistance: The $85,500 - $88,700 zone acts as a critical resistance.
Support: The nearest key support zone is $79,000.
Indicators:
RSI: Below 50, confirming weak momentum.
MACD: Attempting a bullish crossover, but still below the signal line.
Conclusion: BTC needs to break above $85,500 for a bullish shift. Otherwise, we could see further downside to $79,000.
1H (1-Hour) Chart Analysis
Short-term Structure: BTC is testing resistance at the 200 EMA, which could act as a rejection level.
Potential Play:
If BTC fails to break above $84K, a short trade towards $79K makes sense.
If BTC closes above $84,000, a bullish setup towards $88,000 - $91,000 could form.
Indicators:
RSI: Hovering near 40, not showing strong buying momentum.
MACD: Still bearish but showing signs of a possible crossover.
Conclusion: BTC needs a break and retest of $84,000 for longs; otherwise, bears remain in control.
📈 My Trade Setups for the Week:
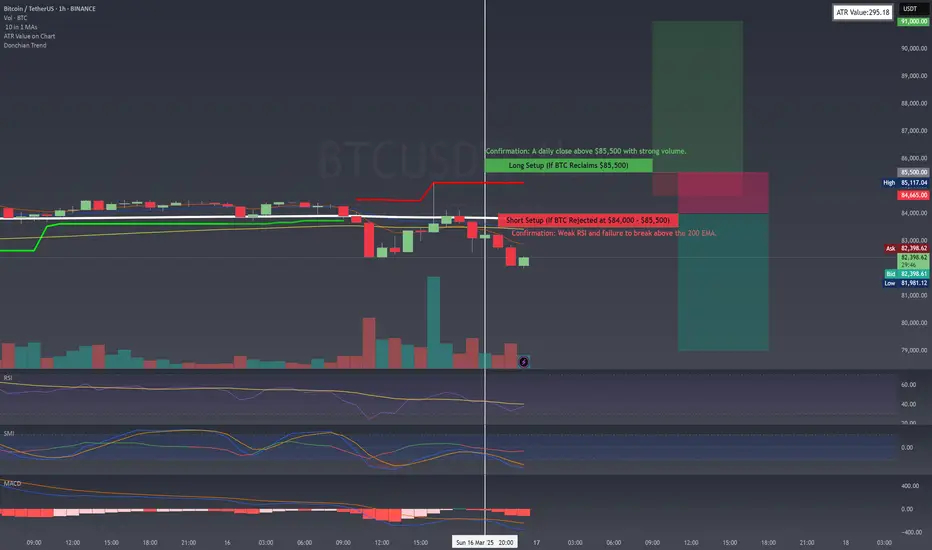
🔴 Short Setup (If BTC Rejected at $84,000 - $85,500)
📉 Entry: $83,500 - $84,000
📉 Stop-Loss: $85,500
📉 Take Profit:
TP1: $80,000
TP2: $79,000
💡 Confirmation: Weak RSI and failure to break above the 200 EMA.
🟢 Long Setup (If BTC Reclaims $85,500)
📈 Entry: $85,500 - $86,000
📈 Stop-Loss: $83,500
📈 Take Profit:
TP1: $88,500
TP2: $91,000
💡 Confirmation: A daily close above $85,500 with strong volume.
📌 Final Thoughts
🔹 BTC remains in a bearish structure, with a possible liquidity grab below $79,000 before any strong reversal.
🔹 If bulls reclaim $85,500, it opens room for a run towards $91,000.
🔹 Best approach: Wait for confirmation at key levels before entering trades.
⚠️ Risk Warning: Always use proper risk management—crypto markets are highly volatile.
💬 What do you think? Are you considering any trades this week? 👇
Trend Overview: BTC has been in a downtrend since its recent peak above $100K, trading below the 100 EMA (yellow) and 200 EMA (white).
Support Zones: The key support zone is around $75,000 - $77,000, where buyers could step in.
Resistance Zones: The major resistance sits near $91,000 - $95,000.
Momentum Indicators:
RSI: Around 40, showing a lack of bullish momentum.
MACD: Bearish crossover, suggesting more downside pressure.
Conclusion: BTC remains under bearish pressure unless it reclaims the 100 EMA. Watch for a possible liquidity sweep below $75K before a bullish reversal.
4H (4-Hour) Chart Analysis
Structure: BTC has been trending below the 200 EMA, confirming a bearish bias.
Resistance: The $85,500 - $88,700 zone acts as a critical resistance.
Support: The nearest key support zone is $79,000.
Indicators:
RSI: Below 50, confirming weak momentum.
MACD: Attempting a bullish crossover, but still below the signal line.
Conclusion: BTC needs to break above $85,500 for a bullish shift. Otherwise, we could see further downside to $79,000.
1H (1-Hour) Chart Analysis
Short-term Structure: BTC is testing resistance at the 200 EMA, which could act as a rejection level.
Potential Play:
If BTC fails to break above $84K, a short trade towards $79K makes sense.
If BTC closes above $84,000, a bullish setup towards $88,000 - $91,000 could form.
Indicators:
RSI: Hovering near 40, not showing strong buying momentum.
MACD: Still bearish but showing signs of a possible crossover.
Conclusion: BTC needs a break and retest of $84,000 for longs; otherwise, bears remain in control.
📈 My Trade Setups for the Week:
🔴 Short Setup (If BTC Rejected at $84,000 - $85,500)
📉 Entry: $83,500 - $84,000
📉 Stop-Loss: $85,500
📉 Take Profit:
TP1: $80,000
TP2: $79,000
💡 Confirmation: Weak RSI and failure to break above the 200 EMA.
🟢 Long Setup (If BTC Reclaims $85,500)
📈 Entry: $85,500 - $86,000
📈 Stop-Loss: $83,500
📈 Take Profit:
TP1: $88,500
TP2: $91,000
💡 Confirmation: A daily close above $85,500 with strong volume.
📌 Final Thoughts
🔹 BTC remains in a bearish structure, with a possible liquidity grab below $79,000 before any strong reversal.
🔹 If bulls reclaim $85,500, it opens room for a run towards $91,000.
🔹 Best approach: Wait for confirmation at key levels before entering trades.
⚠️ Risk Warning: Always use proper risk management—crypto markets are highly volatile.
💬 What do you think? Are you considering any trades this week? 👇
Disclaimer
The information and publications are not meant to be, and do not constitute, financial, investment, trading, or other types of advice or recommendations supplied or endorsed by TradingView. Read more in the Terms of Use.
Disclaimer
The information and publications are not meant to be, and do not constitute, financial, investment, trading, or other types of advice or recommendations supplied or endorsed by TradingView. Read more in the Terms of Use.