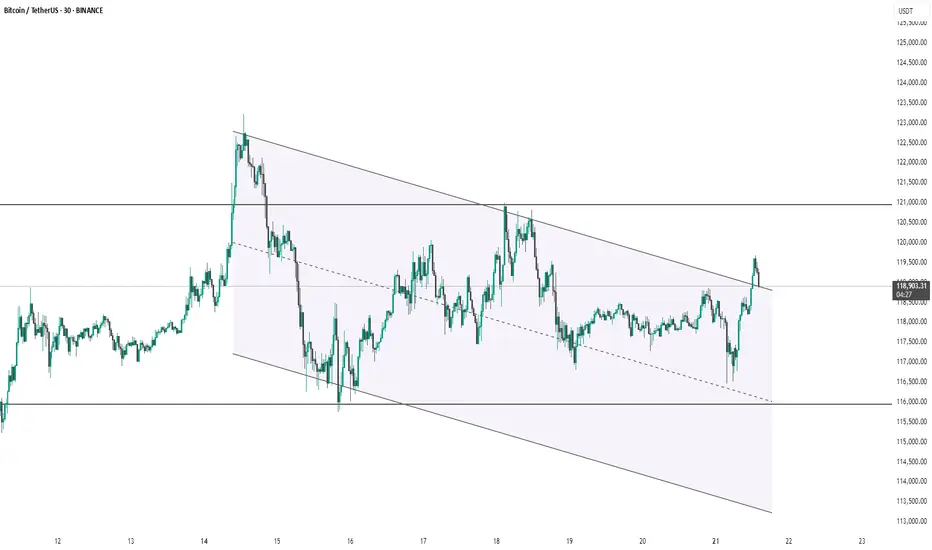
This Bitcoin (BTC/USDT) 30-minute chart shows price action within a descending parallel channel. Recently, the price broke out above the channel's upper boundary, suggesting a potential bullish breakout. However, the price has slightly pulled back, now retesting the breakout zone near $119,000. Holding above this level may confirm the breakout and lead to further upside, while failure to hold could signal a false breakout and potential return into the channel. Key support and resistance levels are marked around $116,000 and $121,000 respectively.
thanking you
thanking you
Related publications
Disclaimer
The information and publications are not meant to be, and do not constitute, financial, investment, trading, or other types of advice or recommendations supplied or endorsed by TradingView. Read more in the Terms of Use.
Related publications
Disclaimer
The information and publications are not meant to be, and do not constitute, financial, investment, trading, or other types of advice or recommendations supplied or endorsed by TradingView. Read more in the Terms of Use.