📈 BTC Forming Higher Highs & Lows | Watch the Wedge Breakout 📉
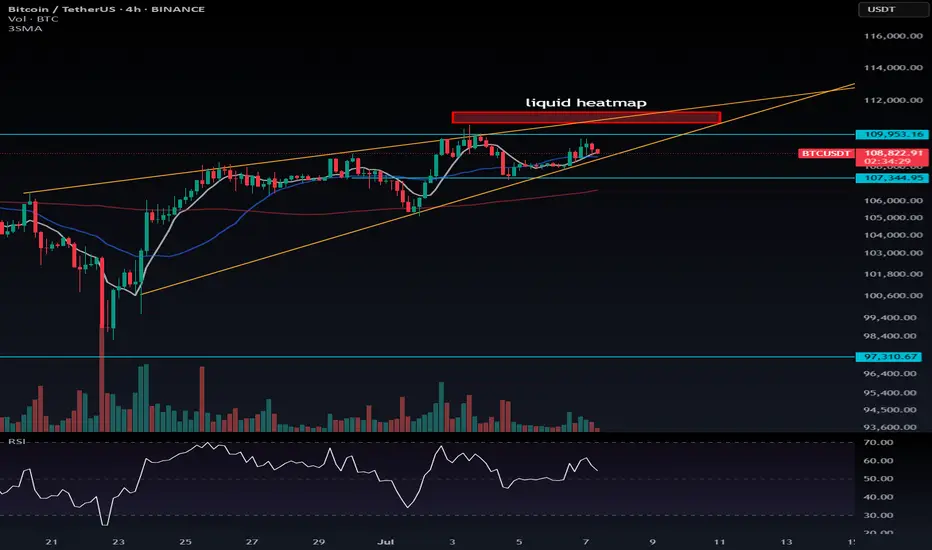
In the uptrend that started around $100K, Bitcoin is forming higher highs and higher lows on the 4H timeframe, which is in line with Dow Theory. Based on the orange lines I’ve drawn, it seems we are moving inside a rising wedge pattern.
🟠 Key Observations:
Breakout from either side of the wedge can trigger a trade, but I personally won’t enter based solely on the wedge.
If BTC breaks upwards, I’ll hold my existing long, not looking to short — because the mid and long-term trend is still bullish.
📌 New Trigger Level: The previously important level of $110,246.8 is now less relevant for me. The market has already rejected from $109,953.16, so that’s my new key level.
👉 I’ve placed a stop-buy order at $109,953.16 based on the 1H chart.
💣 Short Liquidation Zone (Updated):
Now ranges between $110,640 to $111,320
If you're looking to trade momentum:
RSI above 70 on 4H, or
Above 76.23 on 1H = potential trigger for long entries
👉 I'm planning to open a long position above $109,953.16 using a stop-buy order, with the help of the order book in the exchange.
⚠️ Currently, I don’t have a high-confidence stop-loss level — I’ll update as I see clearer price action.
🧠 Pro Tip:
Do everything you can to catch a BTC long position. If you understand risk management and position sizing, don’t be afraid of stop-losses — they’re part of the game.
If you're unsure what proper risk/money management is, go learn it now, or you will definitely get liquidated someday.
Disclaimer
The information and publications are not meant to be, and do not constitute, financial, investment, trading, or other types of advice or recommendations supplied or endorsed by TradingView. Read more in the Terms of Use.
Disclaimer
The information and publications are not meant to be, and do not constitute, financial, investment, trading, or other types of advice or recommendations supplied or endorsed by TradingView. Read more in the Terms of Use.