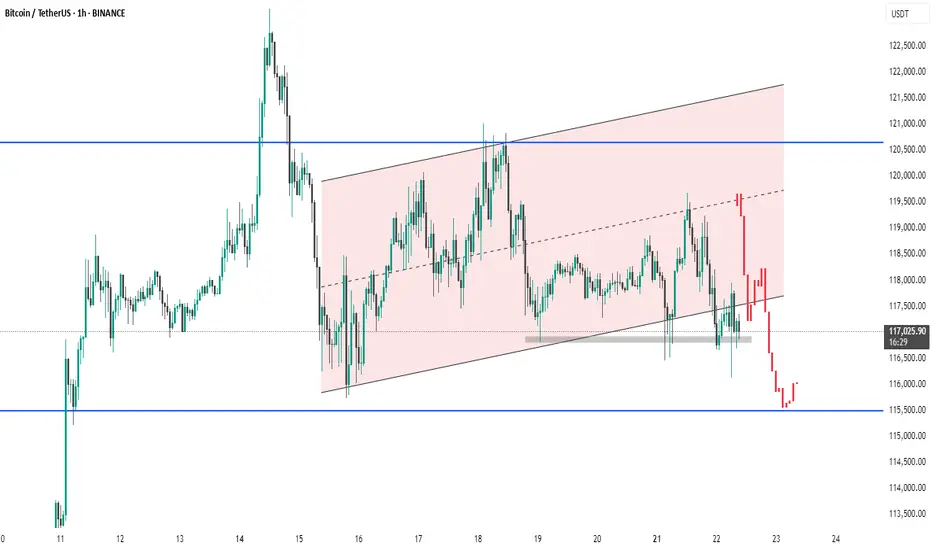
This 1-hour Bitcoin/USDT chart from Binance shows a recent breakdown from a rising parallel channel (highlighted in pink). Price action broke below the lower trendline and a key support zone (grey area), indicating a bearish shift. The strong red candles signify increased selling pressure. The next major support lies near 115,500 USDT (blue horizontal line), which could act as a potential bounce zone.
thanking you
thanking you
Related publications
Disclaimer
The information and publications are not meant to be, and do not constitute, financial, investment, trading, or other types of advice or recommendations supplied or endorsed by TradingView. Read more in the Terms of Use.
Related publications
Disclaimer
The information and publications are not meant to be, and do not constitute, financial, investment, trading, or other types of advice or recommendations supplied or endorsed by TradingView. Read more in the Terms of Use.