
Another quick update for short-term analysis.
I wanted to point out there is yet another trend line that is the cause for the resistance over the past 2-3 hours. Some people may look at this and go “oh you’re just drawing trend lines anywhere and everywhere”.
Well the thing is, the price already pierced the other resistance line drawn from 8.9k downward (not shown on chart), and with the black support underneath and the blue resistance above, that only leaves one last trend line for this range that we need to break in order to give us some short-term direction. That area to break is circled in yellow on the chart.
Something I just noticed however, is the first signs of a bearish divergence on the 1hr time frame. We can see the price is making a higher high, while the RSI is making a lower high.
The second thing I noticed is the amount of buying volume is getting lower and lower each leg up from 6.5k up. All of these signs point to a bearish reversal soon, but because we are looking at such a small span of time, it probably won’t be a big drop.
Also, be aware that these conditions can easily change, the RSI can prop right back up and surge past the last high on the RSI, which would no longer give us a bearish divergence.
Secondly, this orange trend line can easily be pierced, so the first thing I am looking for is to see the price break through this orange line so that I can place my next target at the blue resistance line above.
If price does not break the orange line, then the next target becomes the green support line below.
Trade active
Per usual, my predictions were made a tad bit earlier than expected but sure enough the dump finally happened. I was out last night on my phone and saw a second bearish divergence show up on the 1hour and wanted to update this idea but never got the time before I went to sleep. Hopefully you guys didn't get scared into buying after we crossed the orange trend line. Next target is the rising green support line below. I'm going to make a gutsy call this time and say it won't hold up like the last time. Let's see if my original prediction for 5.5k-6k range for reversal ends up playing out (albeit a few days late)Thanks for your support guys!
Note
Here are the next targets to keep an eye on: Note
New update: 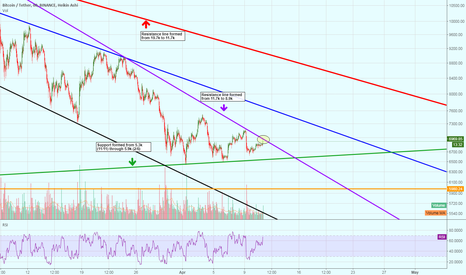
Disclaimer
The information and publications are not meant to be, and do not constitute, financial, investment, trading, or other types of advice or recommendations supplied or endorsed by TradingView. Read more in the Terms of Use.
Disclaimer
The information and publications are not meant to be, and do not constitute, financial, investment, trading, or other types of advice or recommendations supplied or endorsed by TradingView. Read more in the Terms of Use.